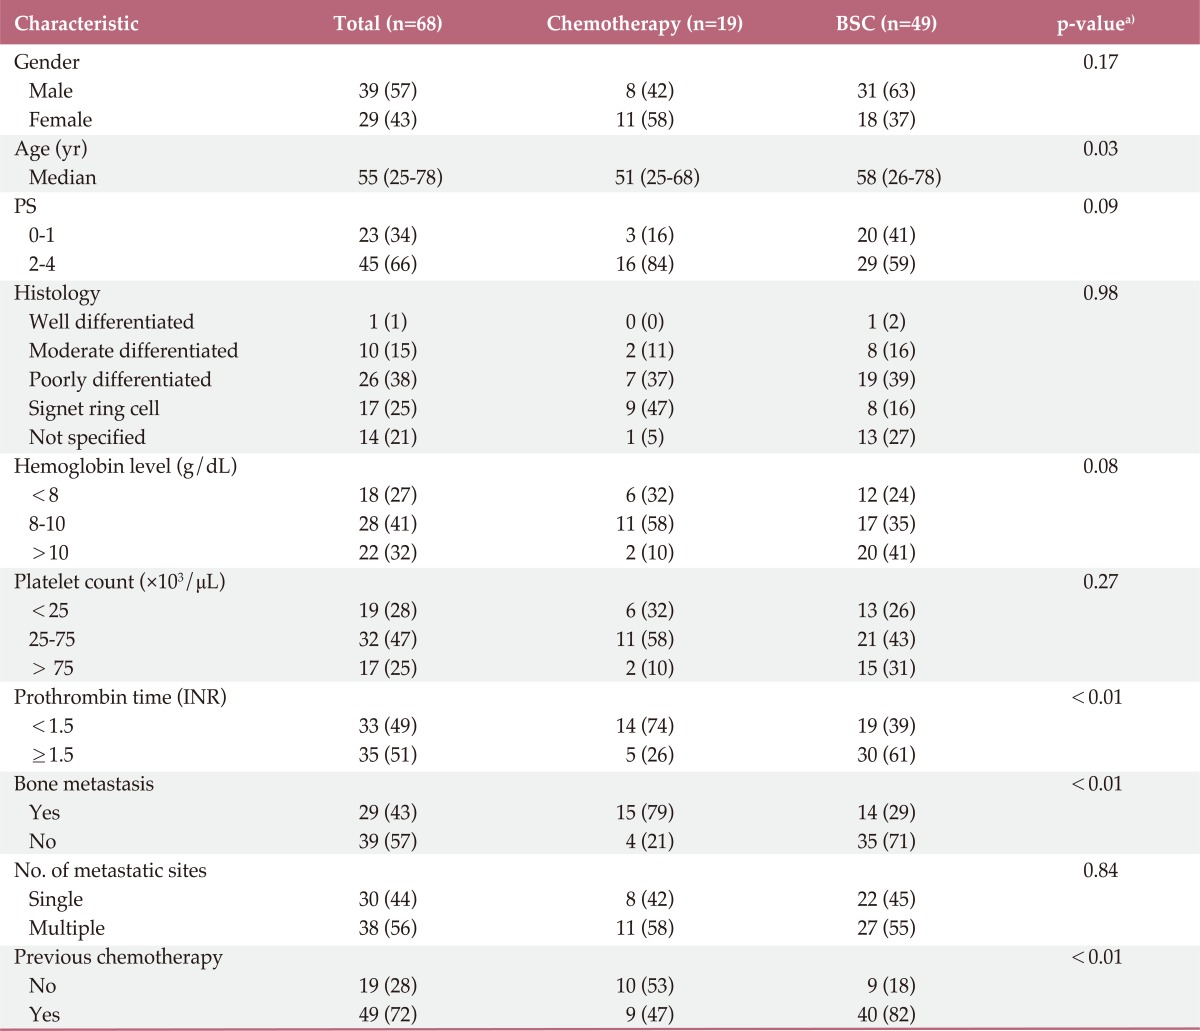
Table 1.
Patient characteristics

Values are presented as number (%). BSC, best supportive care; PS, performance status; INR, international normalized ratio. a)p-values are for comparison between BSC and chemotherapy.
Patient characteristics

Values are presented as number (%). BSC, best supportive care; PS, performance status; INR, international normalized ratio. a)p-values are for comparison between BSC and chemotherapy.