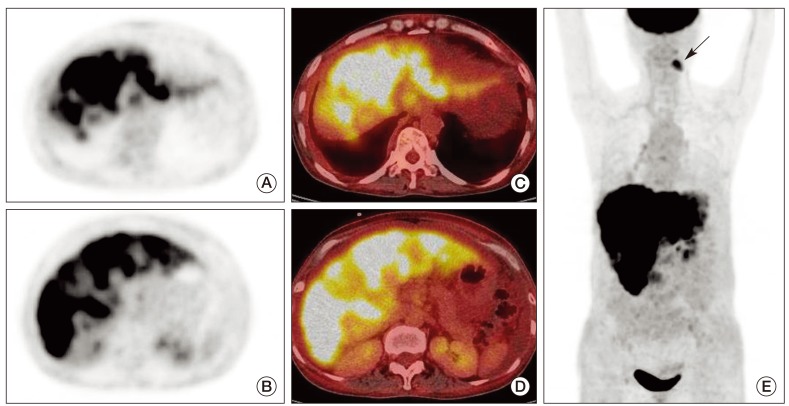
Fig. 2.
F18 fluorodeoxyglucose positron emission tomography/computed tomography images taken on April 3, 2012. Axial positron emission tomography (A, C) and fusion (B, D) images show diffusely and heterogeneously increased activity in known hepatic metastases. Maximum intensity projection image (E) also shows extensive hepatic metastasis. Focally and incidentally increased activity (arrow) is seen in an abscess of the left mandible.

