Figure 2.
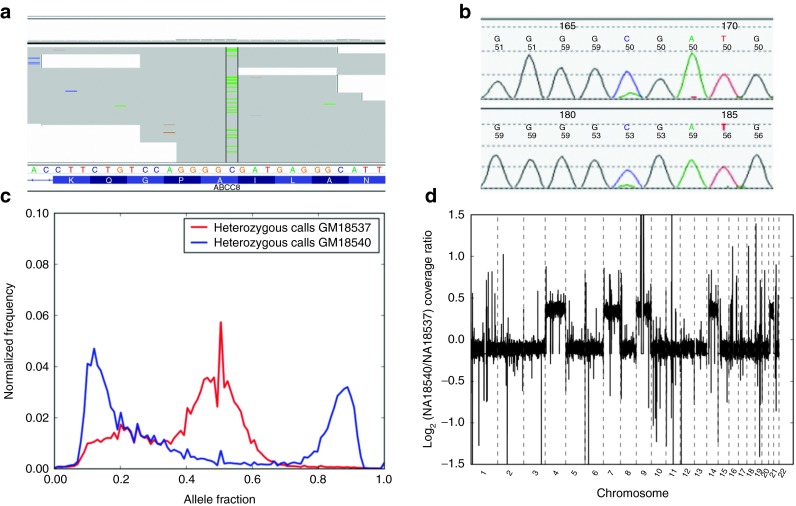
Skewed allelic fractions in aneuploid cell-line GM18540. (a) IGV view of NGS data from GM18540 for the non-reference genotype call of interest (shown between vertical lines). (b) Bidirectional Sanger data for the variant-containing region. (c) Histogram of allele ratios for all non-reference genotype calls in chromosome 11 derived from whole-genome shotgun sequencing (WGSS) of GM18540 and control sample GM18537. (d) Genome-wide relative coverage for GM18540. WGSS coverage data for each of the autosomes was binned into 50 kb intervals and the log-ratios of the per-sample mean normalized values were plotted versus chromosome position. Dashed vertical lines denote chromosome boundaries; within a chromosome the ratios are arranged according to genomic position. IGV, integrative genomics viewer; NGS, next-generation DNA sequencing.

