
Figure 2.
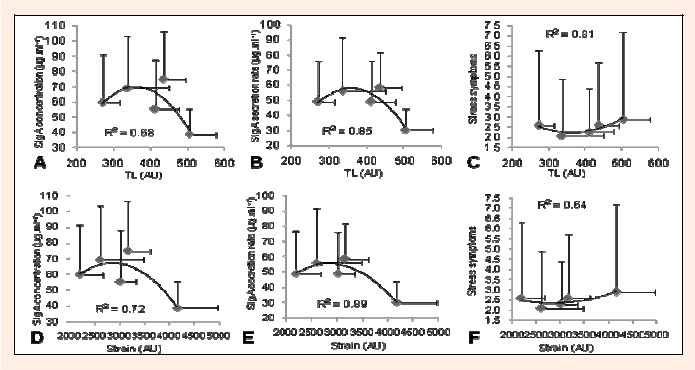
Weekly dose-response relationships based on mean values from 8 players (weeks 1-5) of training load (TL) and strain, with SIgA concentration (A and D), SIgA secretion rate (B and E), and “worse than normal” responses of stress symptoms (C and F) (n = 8).