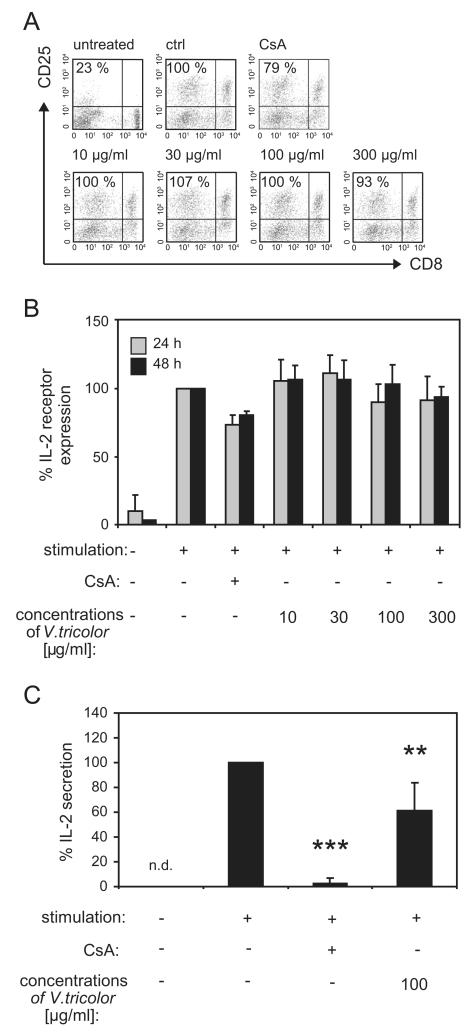
Fig. 3. Influence of Viola tricolor on IL-2 biology of activated lymphocyte.
Untreated lymphocytes (2 × 10⁵ cells), mitogen-activated (PHA-L; 10 μg/mL) cells alone or in the presence of cyclosporine A (CsA, 5 μg/mL) or various concentrations of the Viola extract were cultured for 24 or 48 h. The presence of the IL-2 receptor alpha chain CD25 on CD8+ and CD8− T-lymphocytes was analyzed with anti-human mAbs and by flow cytometry. Representative dot plots (A) indicate the data from proliferating lymphocytes and values (%) from living lymphocytes were gated and presented. Data (mean ± SD) from two to three independent experiments were summarized in (B). For IL-2 secretion analysis cells getting a re-stimulation impuls with PMA (50 ng/mL) and ionomycin (500 ng/mL) after 24 h of culture for 6 h before analysis of the secreted proteins, expressed by amounts of IL-2. The amount of IL-2 was measured in the supernatant of cultured lymphocytes using an ELISA-based cytokine detection method and flow cytometry. Limit of quantification for the IL-2 ELISA was 16.4 pg/mL. The values are normalized (=100%) to untreated stimulated cells (ctrl). Results are summarized in graphs and data are presented as mean7SD from four independent experiments (D). The asterisks represent significant differences of Viola extract-treated cells in comparison to control cells (**P<0.01 and ***P<0.001).

