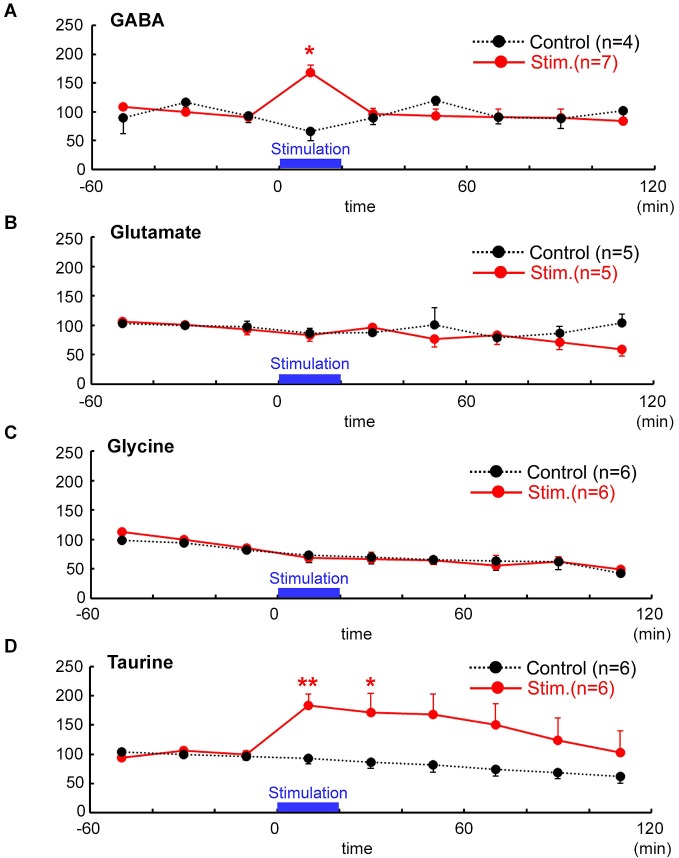
Figure 4.
Temporal changes in neuro-active amino acid concentrations after focal electrical stimulation assessed by microdialysis followed by HPLC. Evoked release (red) of GABA (A) glutamate (B) glycine (C) and taurine (D) were estimated and are indicated as % baseline value. In controls (black), no stimulation was applied. Time after the stimulation is indicated in abscissa (min). Electrical stimulation of 1 mA for 100 µs was delivered at 1 Hz for 20 min, the periods of which are indicated by bars. Baseline values were defined as the average value 60 min immediately before stimulation. Note that taurine and GABA (with 1 mM nipecotic acid), but neither glycine nor glutamate, were significantly increased in response to the electrical stimulation in the MZ. ** P < 0.01, * P < 0.05 as compared with control (Mann–Whitney U-test).

