
Figure 1.
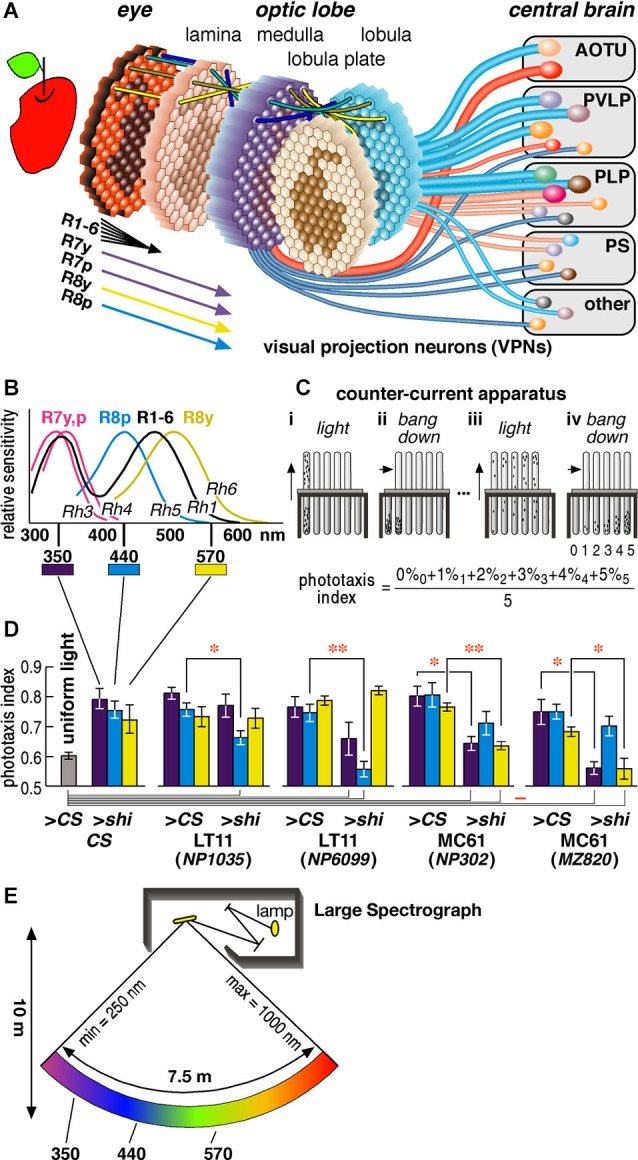
Drosophila visual system and phototaxis assay. (A) Schematic diagram of the Drosophila visual system. Photoreceptors project from about 750 ommatidia of the retina to as many retinotopic columns (visual cartridges) in the four nested neuropils of the optic lobe. Relay interneurons project each retinotopic level onto the next (indicated by four colored lines on top of each neuropil). Hexagons with the projected images of an apple schematize the distribution of retinotopic visual cartridges and the relayed visual field. Cylindrical lines represent the visual projection neurons (VPNs) that connect the lower visual centers in the optic lobe to higher visual centers in the central brain (Otsuna and Ito, 2006). They terminate in the anterior optic tubercle (AOTU), posterior ventrolateral protocerebrum (PVLP), posterior lateral protocerebrum (PLP), posterior slope (PS) and a few other neuropils. The diameters of the lines reflect the numbers of neurons per pathway. Two red lines represent the pathways we analyzed in this study. (B) Sensitivity spectra of the photoreceptors (Salcedo et al., 1999). (C) The counter-current apparatus. Flies were put in the first tube and allowed to run towards the light for 30 s (panel i). The flies moved to the opposite tube were transferred to the bottom of the next tubes by tapping (ii) and let run towards light again (iii). After repeating this process five times (iv), flies were distributed to six tubes according to the times they moved towards light (0–5). (D) Phototaxis indices of the wild-type CS flies in the apparatus lit completely uniformly with white lamp (as negative control) and of the CS flies and GAL4 driver lines crossed with either CS (>CS, as positive control) or UAS-shits1 (>shi) towards specific wavelengths of light (at 30°C). Mean ± SEM of three independent measurements with different sets of flies were shown. Statistical significance of differences by t-test is indicated with * (p < 0.05) and ** (p < 0.01) below the abscissa indicates the cases that were not significantly different from the behavior under uniform light (p > 0.05). (E) Schematic diagram of the Okazaki Large Spectrograph (OLS).