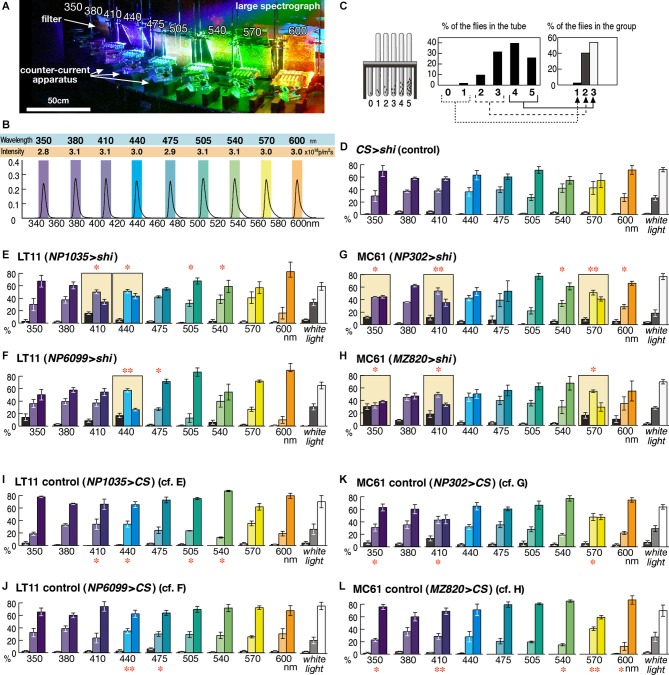
Figure 2.
Detailed phototaxis assay across the visual spectrum of the fly eye. (A) Experimental setup of the OLS. Filters are placed in front of the counter-current apparatus to normalize the light intensity. For actual measurement, illumination except for a single apparatus was blocked in order to avoid the effect of stray light. (B) Intensity and spectrum of the light used for each experiment, measured at the center of the apparatus. Colored boxes indicate the wavelength range that illuminates each apparatus. (C) To minimize minor fluctuation of data, counts of the six tubes (0–5) are merged into three groups, which correspond to the flies that seldom moved towards light (left column, 1), moved or stayed roughly at random (middle, 2), and moved most of the time (right, 3). (D) Control experiment of the wild-type CS flies crossed with UAS-shits1 (CS > shi) at 30°C. Mean ± SEM of three independent measurements. (E–H) Phenotypes of the GAL4 driver strains crossed with UAS-shits1 at 30°C. Colored background rectangles indicate the cases in which flies showed aberrant phototaxis. The cases that were significantly different from the control (I–L) are indicated with ** (p < 0.01) and * (p < 0.05, t-test). (I–L) Control phototaxis experiment of (E–H); each GAL4 line was crossed with wild-type CS. Phototaxis at 30°C was normal in all the cases.

