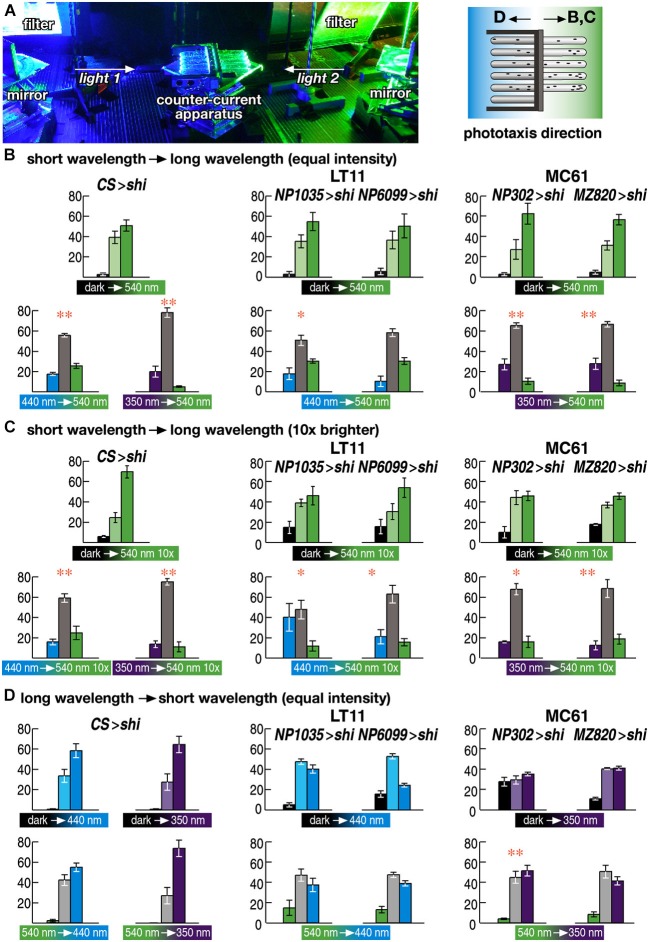
Figure 4.
Wavelength choice assay. (A) Experimental setup. Two wavelengths of light are redirected using a pair of mirrors and introduced to the counter-current apparatus from both sides. Flies were allowed to run either from shorter to longer wavelength of light (B, C) or from longer to shorter wavelength (D). (B–D) Choice assay between the wavelengths to which flies showed normal (540 nm) or aberrant phototaxis (440 and 350 nm for LT11 and MC61, respectively). Light intensity was adjusted to the same level as in Figure 3 (3 × 10¹⁸ p/m2s) in (B, D) but was set to 10 times brighter (3 × 10¹⁹ p/m2s) in (D). Mean ± SEM of three independent measurements. Statistical significance of the differences between phototaxis (above) and choice assay (below) are indicated with ** (p < 0.01), * (p < 0.05; t-test).

