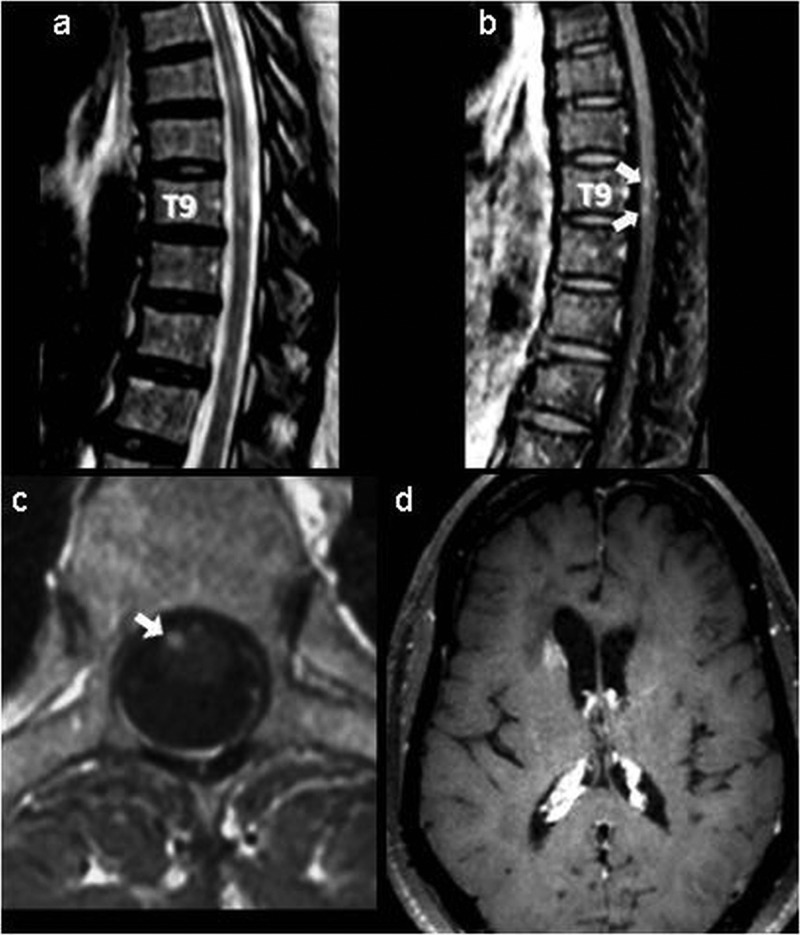
Figure 1.
Spinal MRI: (A) sagittal T2-weighted, (B) postgadolinium T1-weighted images and (C) axial postgadolinium T1-weighted images. Arrows indicate multiple intramedullary T2 high-signal intensity lesions, some of them at the T9 level, displaying T1 enhancement. (D) Brain MRI postgadolinium T1-weighted image. The arrowhead indicates patchy enhancement of the head of the right caudate nucleus.

