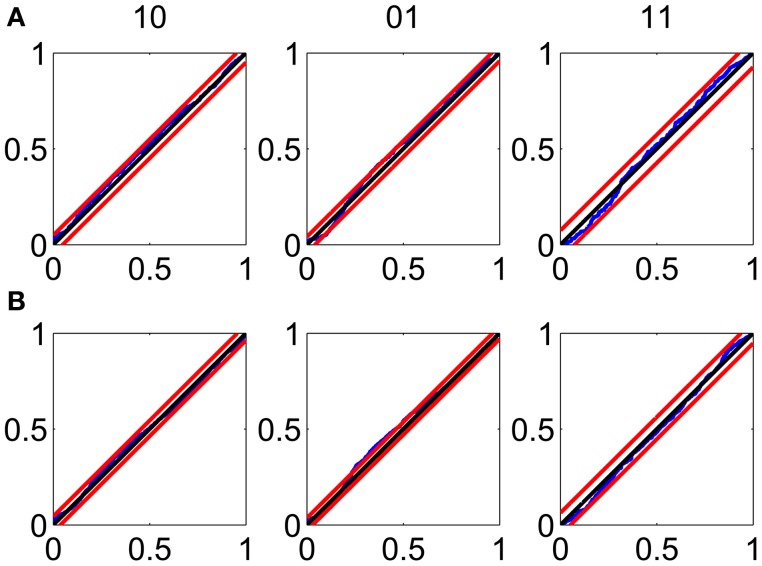
Figure 3.
Goodness-of-fit assessment by KS plots based on the time-rescaling theorem. (A) Time-rescaling performance on the training data. (B) Time-rescaling performance on the test data. In both cases, the parallel red lines correspond to the 95% confidence bounds. The KS plots show that the model fits both the training and test data well. The good KS performance on each of the components of ΔN* demonstrates the model's accurate description of the joint process. The performance on the test data demonstrates the strong predictive power of the model.

