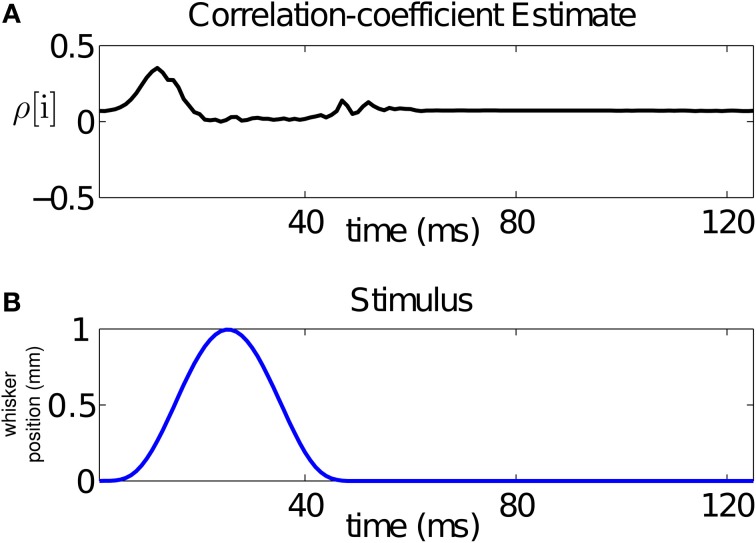
Figure 5.
Time-varying assessment of the correlation between the pair of neurons in Figure 1. (A) Estimate of the correlation coefficient, (B) stimulus over a single period. The figure demonstrates that the stimulus changes the correlation structure, hence the dependence, between the neurons in the pair at the ms time scale. For this pair, the rising cycle of the stimulus increases the correlation beyond baseline and then decreases it, while the falling cycle makes the uncorrelated, before returning to baseline.

