Figure 6.
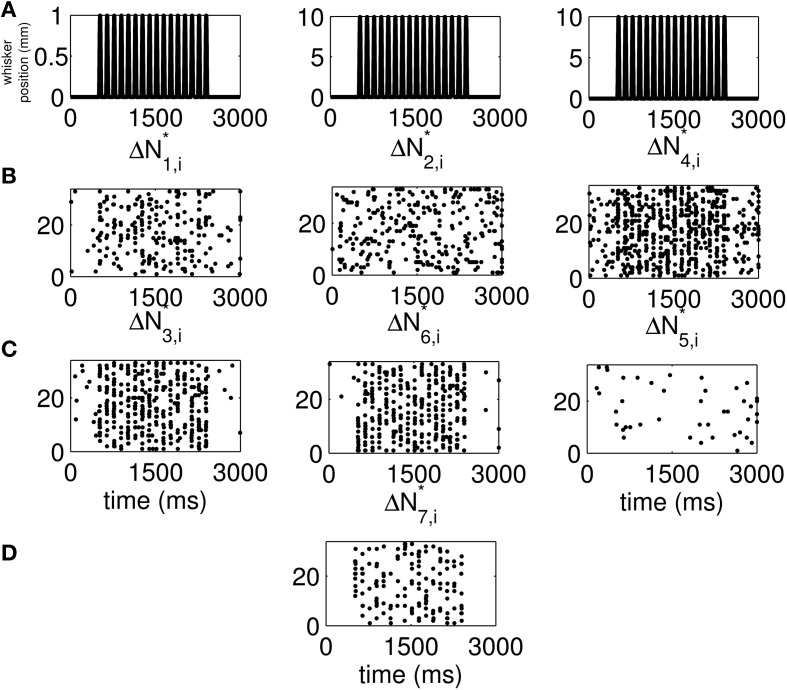
New raster plots of non-simultaneous (“100,” “010,” and “001”) and simultaneous (“110,” “011,” “101,” and “111”) spiking events for the three simulated neurons of in Figure S15. (A) Stimulus (same as in Figures 1A, 2A). (B) Non-simultaneous events, from left to right, “100,” “010,” and “001.” (C) Simultaneous events from pairs of neurons, from left to right, “110,” “011,” and “101.” (D) Simultaneous event from the three neurons (“111”). The new raster plots of the three components show clearly the effects of the stimulus on non-simultaneous and simultaneous spiking. The ΔN*4,i and ΔN*5,i components of ΔN* show that the joint spiking activity of the pairs consisting of Neurons 1 and 2 on the one hand, and Neurons 2 and 3 on the other hand is pronounced. The ΔN*7,i component of ΔN* shows that the joint spiking activity of the three neurons is also pronounced. The information in these raster plots about the joint spiking activity of neurons could not be gathered from Figure S15.

