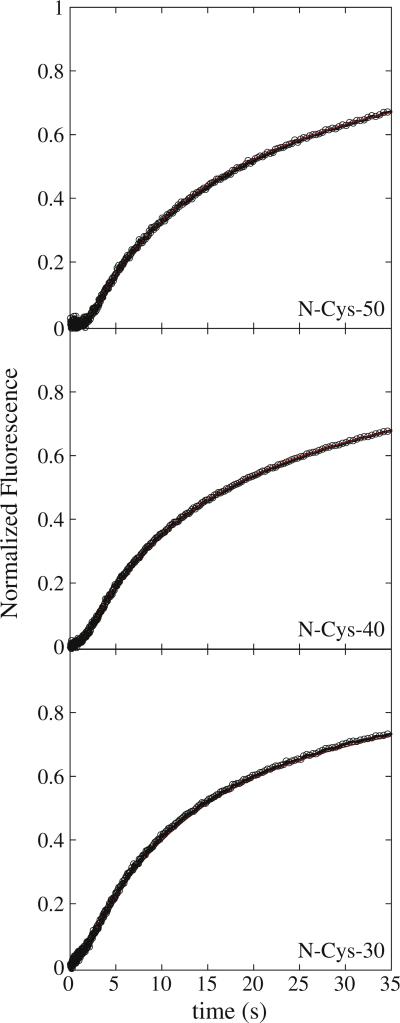
Fig. 2.
Fluorescence time courses for ClpAP catalyzed polypeptide translocation. Time courses represent 1 μM ClpA, 1.2 μM ClpP, 150 μM ATPγS, and 20 nM fluorescein-labeled polypeptide substrate pre-assembled prior to rapid mixing with 600 μM ATP and 300 μM SsrA. Shown are time courses for ClpAP catalyzed translocation of N-Cys-50, NCys-40, and N-Cys-30 polypeptide substrates. The red continuous lines represent a global NLLS fit using Scheme 2 for time courses collected with substrates I–III in Table 1. The resultant parameters are kT = (4.69 ± 0.09) s–1, kC = (0.12 ± 0.01) s–1, kNP = (0.02 ± 0.002) s–1, m = (4.6 ± 0.3) aa step–1, and mkT = (21.5 ± 1.1) aa s–1. Each time course was analyzed under a given set of conditions by constraining the parameters kT, kC, kNP, and h to be global parameters, while Ax, xx, and nx were allowed to float for each polypeptide length, where the subscript “x” represents the polypeptide substrate length.

