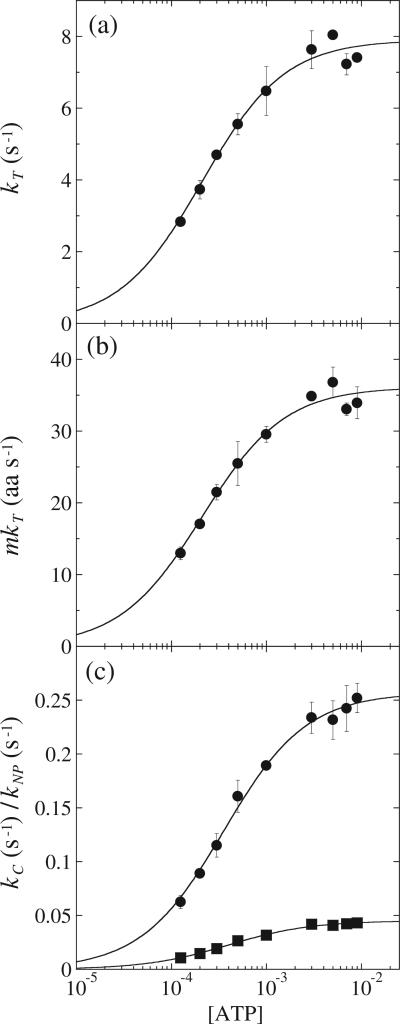
Fig. 5.
(a) Dependence of kT on [ATP], where the continuous line is the result of an NLLS fit to Eq. (4) with the Hill coefficient constrained to equal one for kT,max = (7.9 ± 0.2) s–1 and Ka = (4.8 ± 0.5) × 103 M–1. (b) Dependence of mkT on [ATP], where the continuous line is the result of a NLLS fit to Eq. (6) with the Hill coefficient constrained to equal one for mkT,max = 36.1 ± 0.7 aa s–1 and Ka = (4.8 ± 0.5) × 103 M–1. (c) Dependence of kC (filled circles) and kNP (filled squares) on [ATP], where the continuous line is the result of a NLLS fit to Eq. (4) with the Hill coefficient constrained to equal one. For kC and kNP, the equilibrium constant, Ka, is (2.8 ± 0.1) × 103 M–1 and (2.5 ± 0.1) × 103 M–1, respectively. The analysis of kC and kNP also yielded estimates of the maximum microscopic and macroscopic rates of translocation as 0.26 ± 0.003 s–1 and 0.045 ± 0.001 s–1, respectively.

