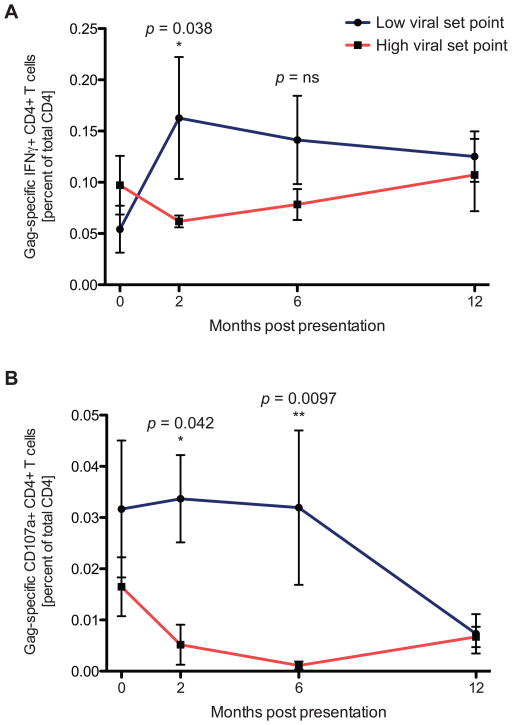
Figure 2. HIV-specific CD4 T cell responses during acute HIV infection.
HIV-specific CD4 T cell responses expand in acute HIV infection in subjects progressing to lower viral set points. (A) The Gag-specific IFNγ+ CD4 T response was evaluated longitudinally in individuals who progressed to a lower viral set point (blue, n=6) and in those who progressed to a high viral set point (red, n=5). A significant difference in the IFNγ response levels was noted at 2 months post presentation (p=0.038, Mann-Whitney test) (B) Longitudinal monitoring of the Gag-specific CD4 T cell degranulation (CD107a) response was performed following acute HIV infection in subjects progressing to low (blue, n=6) and high (red, n=5) viral set points. Significant differences in CD107a expressing CD4 T cells between patient groups are observable at both 2(0.034 versus 0.005; P = 0.042, Mann-Whitney test) and 4 months after presentation (0.032 versus 0.001; P = 0.0097, Mann-Whitney test).

