
Figure 2.
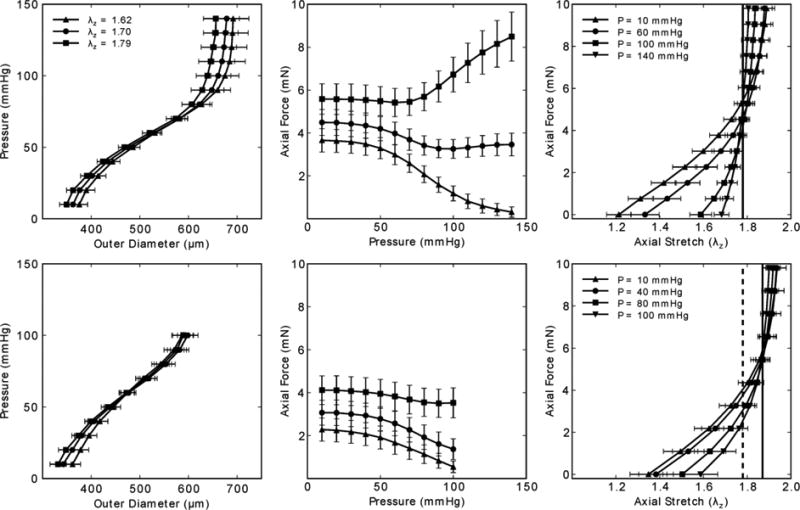
Mean pressure – diameter (left) and transducer-measured axial force – pressure (middle) data during cyclic P-d tests at multiple axial stretches, plus mean transducer-measured axial force – stretch data during cyclic f-l tests on common carotid arteries; the error bars show the SEM, with n = 5 each, which represents a sub-set of the overall n =16 control group. Note, too, that all data shown was taken from unloading curves. Passive results are shown in the top panels and active results (in response to [PE] = 10-5 M) in the bottom panels. Note in the bottom right panel that the “cross-over” point changed upon activation from (dashed vertical line) to (continuous vertical line).