
Figure 3.
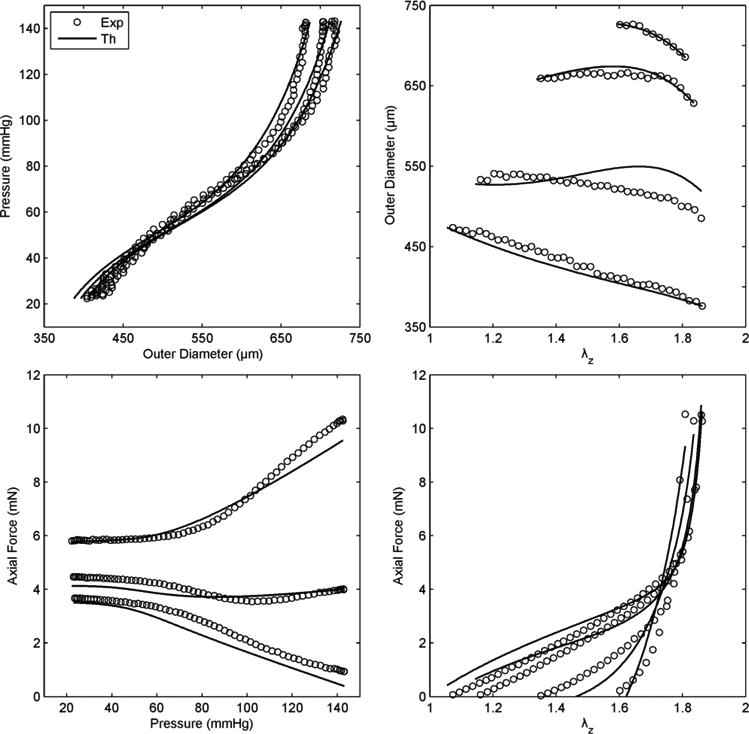
Representative fit (solid lines), via a single set of best-fit parameters for the four-fiber family model (Eq. 6, Table 2), to data (symbols, with only one-sixth of the actual data shown for visual clarity) for seven P-d and f-l protocols performed on a representative common carotid artery from a control mouse. Note the nearly constant force – pressure response (bottom left) indicating near in vivo stretch conditions.52