
Figure 5.
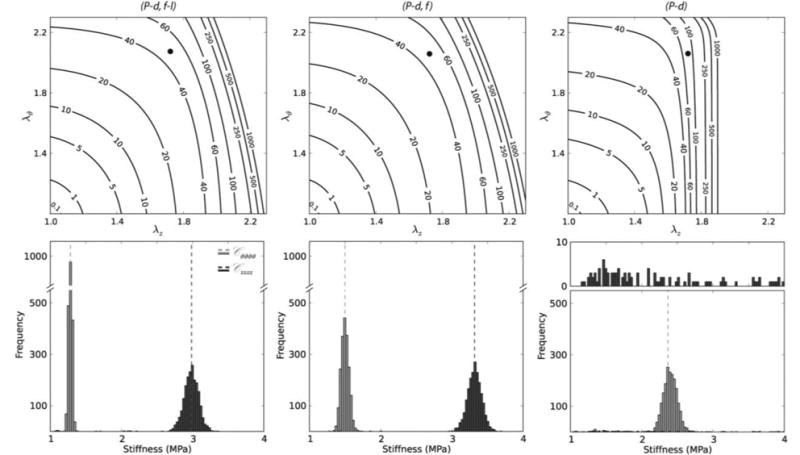
Stored energy W contours (top panels) and nonparametric bootstrap values of the circumferential and axial components of linearized stiffness (bottom panels), each based on the four-fiber family model and best-fit model parameters (Table 2) for averaged data for passive common carotid arteries from n = 16 control mice. Solid black dots in the top panels represent systolic values in the λz – λϑ plane at which the linearized stiffnesses were evaluated. The dashed vertical lines in the bottom panels represent values of circumferential (Cϑϑϑϑ) and axial (Czzzz) stiffness that were obtained using the averaged data set while the distributions were obtained via bootstrapping. In particular, results in the left panels are based on parameter estimations using the full biaxial data (P-d, f-l), results in the middle panels are based on parameter estimations using P-d data and associated axial forces (P-d, f), and results in the right panels are based on parameter estimations that used pressure-diameter data alone (P-d). See Table 1 for a comparison with values of stiffness obtained by analyzing individual data sets and Table 2 for the respective mean values of the model parameters. Note that the first two methods yielded similar results (P-d, f had slightly shifted distributions compared with those for P-d, f-l), but results based on pressure-diameter data (P-d) alone were markedly over estimated for the circumferential direction and simply not reliable for the axial direction (essentially yielding a random distribution with low frequency of occurrence over a wide range of stiffness values) as would be expected due to the absence of axial information.