
Flowchart 1.
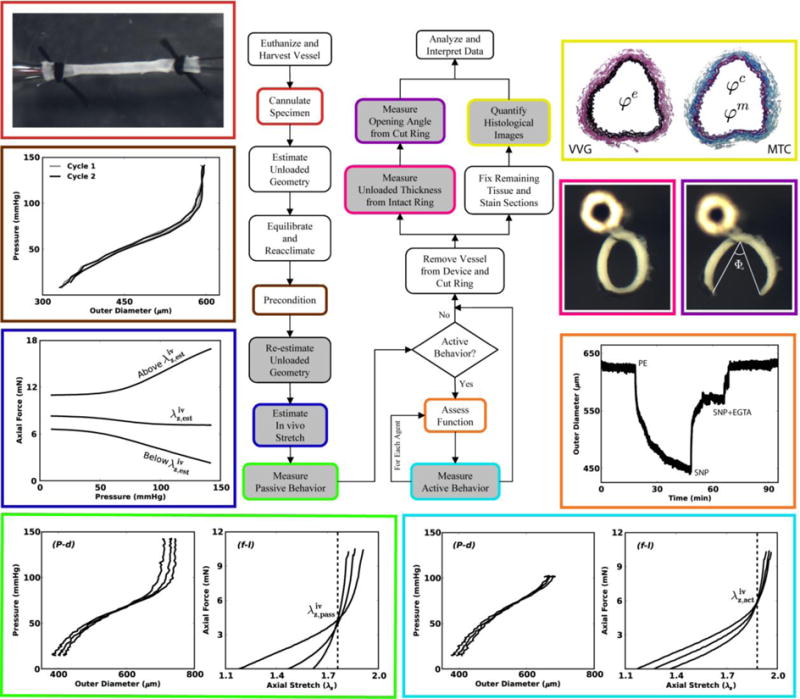
This illustrated schema shows possible sequences of experiments that can aid in the biomechanical phenotyping of mouse arteries. In particular, beginning in the upper left and moving counter-clockwise, we show a cannulated carotid artery secured using sutures, two cycles of pressure-diameter data that are nearly superimposed (which reveals the efficacy of the prior preconditioning) with little hysteresis (which reveals the utility of a pseudoelastic constitutive approach), estimation of the in vivo axial stretch ratio based on the near constancy of the transducer-measured force – pressure response during cyclic P-d testing, and typical P-d and f-l responses in passive (bottom left) and active (bottom right) states, for which the vertical lines highlight the intersection in the f-λz data (which reveal the in vivo axial stretches for passive and active states). Next, we show results from a functional test starting with a near passive state in a Hank's solution followed by contraction to phenylephrine ([PE]=10-5 M), relaxation in response to sodium nitroprusside ([SNP]=10-4 M), and recovery of the original passive state with sodium nitroprusside plus [EGTA] = 2 × 10⁻³ M in a calcium-free bath. Finally, we show images of tethered traction-free rings before and after introducing a residual stress relieving radial cut (with opening angle Φo), as well as Verhoeff van Gieson (VVG) and Masson's trichrome (MTC) stains to highlight elastic fibers (black in VVG), collagen fibers (blue in MTC), and cytoplasm (red in MTC, but very faint in this reduced image).