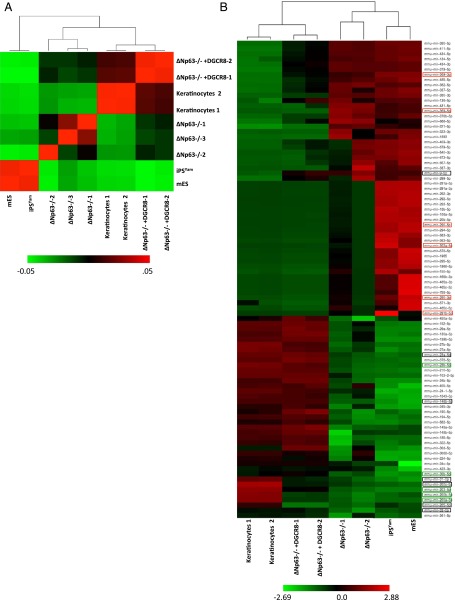
Fig. 3.
miRNA signature of ΔNp63−/− epidermal cell lines. (A) Pearson’s correlation analysis from miRNA-Seq performed using the indicated samples. (B) Heat map showing supervised hierarchical clustering. Low miRNA expression is indicated in green and high expression in red. Boxes indicate miRNAs that were most significantly up- (red) or down- (green) regulated in the ∆Np63/iPS cell signature. The signature that was found to be most highly significant is boxed in black.

