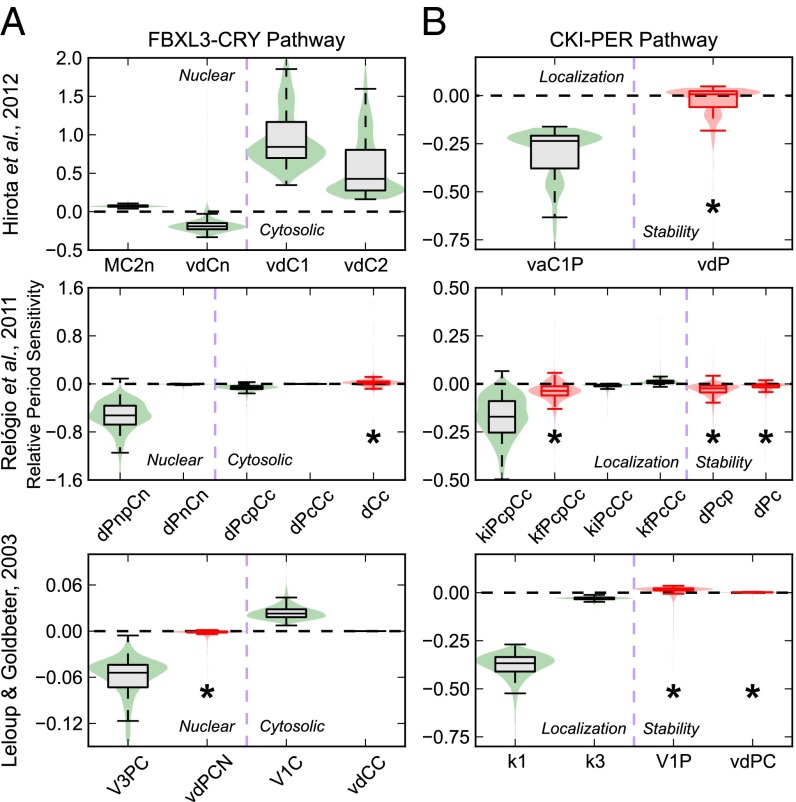
Fig. 3.
Bootstrap predictions of circadian actions of FBXL3-CRY and CKI-PER pathways. Violin plots of the relative period sensitivity of parameters associated with potential mechanisms for FBXL3-CRY (A) and CKI-PER (B) activity, in which a box plot is superimposed above a kernel density plot to convey the distribution of sensitivities across 2,000 realizations. The whiskers used extend to the most extreme data point within 1.5× the inner quartile range. A negative or positive period sensitivity indicate that the period of oscillation will increase or decrease when that rate is inhibited, respectively. Distributions that are not different from 0 with 95% confidence are colored red and marked with an asterisk. Descriptions of the parameters shown are listed in Tables 1 and 2.

