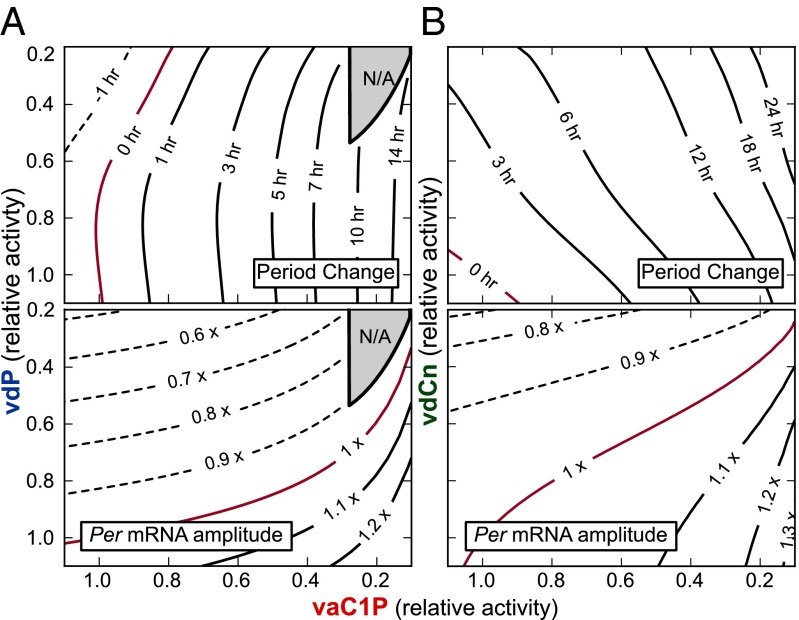
Fig. 5.
Independence of CKI-PER and FBXL3-CRY pathways. (A) Contour plots of period change (Upper) and Per mRNA amplitude (Lower) for simultaneous inhibition of both PER degradation (vdP) and nuclear import (vaC1P). The gray shaded region indicates loss of oscillations. (B) Period and amplitude change contour plots for varying both vdCn (CRY nuclear degradation rate) and vaC1P (PER-CRY nuclear import).

