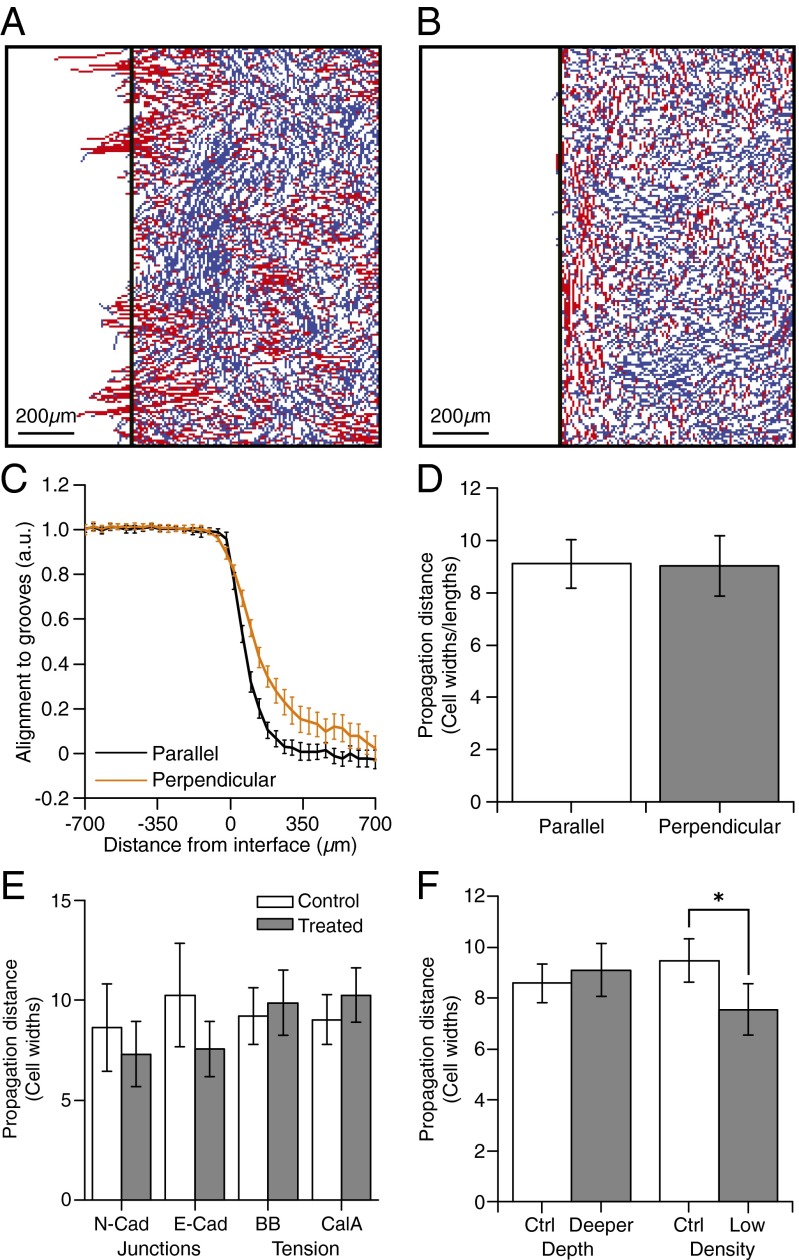
Fig. 2.
Quantification of guidance propagation from a topographic feature. Guidance propagates about nine cells. Groove depth, adherens junctions, and myosin activity do not affect propagation distance. (A and B) Migration tracks of cells located on the flat region at start of the experiment on surfaces with (A) grooves perpendicular or (B) grooves parallel to the interface. Tracks are colored according to their angles [guided (red) versus nonguided (blue)]. (C) Quantification of alignment of cell migration direction with groove direction as a function of distance from the interface for grooves parallel or perpendicular to the interface. (D) Propagation distance from the interface, quantified as the distance at which the curves in C reach 0.321 (i.e., cells no longer move within 25° of the groove direction) for grooves parallel and perpendicular to the interface. (E) Propagation of guidance signals from the interface for parallel grooves in GFP-N-cadherin overexpressing ARPE-19 cells, anti–E-cadherin-treated ARPE-19 cells, blebbistain (BB)-treated cells, and calyculin A (CalA)-treated cells. No significant difference in signal propagation distance was observed between treated and control cells. Measurements were made on at least 19 wells from at least three independent experiments. (F) Propagation distance from the interface measured for parallel grooves of different depths and for cell sheets at different densities. No significant difference in signal propagation distance was observed between deep and shallow grooves. Sheets with a high cell density did, however, show a significantly higher propagation distance than cells in low-density sheets.

