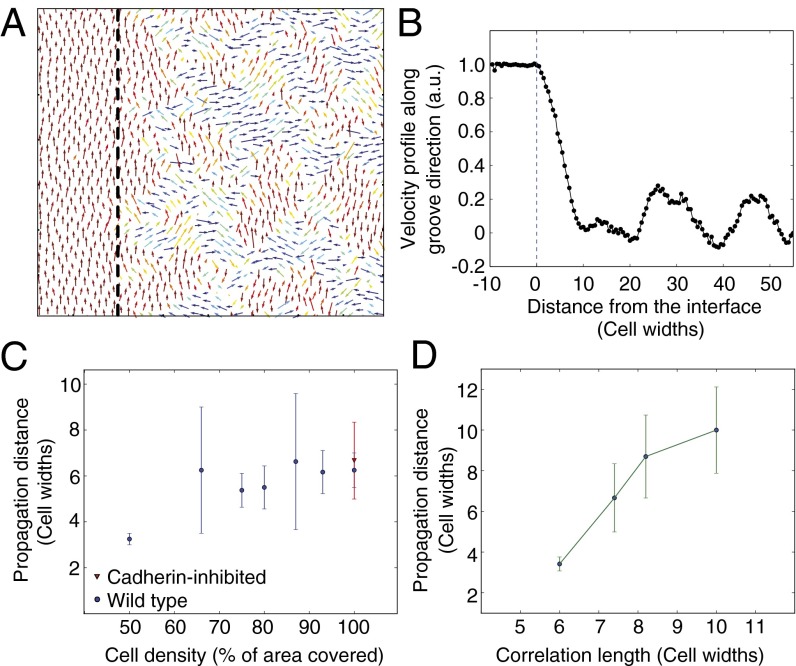
Fig. 3.
Propagation distance predictions from computational modeling. (A) Cell velocity field from computational model. Cells to the left of the interface (indicated by the dashed line) were biased to move vertically, mimicking cells on grooves. No bias was applied to cells to the right of the interface. Arrows are placed at the center of each cell within the sheet. Colors indicate the direction of migration. (B) Mean vertical velocity as a function of the distance from the interface for the parallel grooves case. The data are normalized so that the mean vertical velocity on the grooves is 1. The propagation distance is defined by the intersection between the curve and 0.321. (C) Propagation as a function of cell density for wild-type (blue) and cadherin-inhibited (red) cells. (D) Propagation distance as a function of the correlation of the cell population. According to the model, a correlation exists between propagation distance and correlation length. Error bars represent 95% confidence intervals.

