Fig. 2.
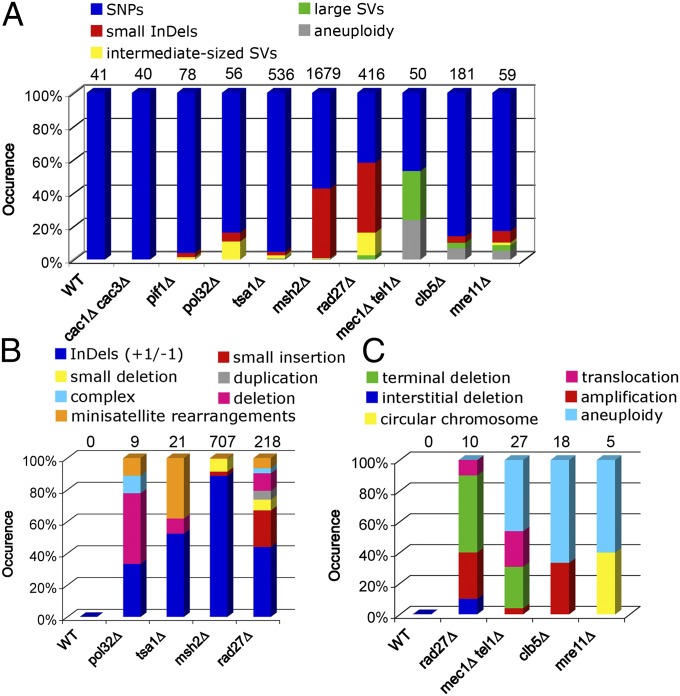
Mutational profiles. (A) Overview of the spectrum of mutations accumulated in each of the sequenced haploid MA lines. The total number of mutations per strain is shown at the top of the panels. (B) Type of InDels. (C) Type of large SV mutations. In B and C, only the mutator strains that accumulated more than eight events are depicted.

