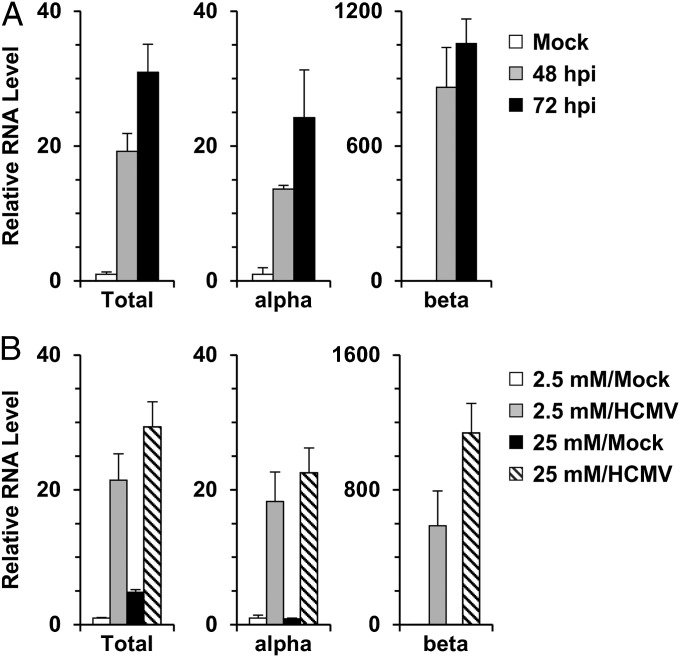
Fig. 2.
Expression of ChREBP isoforms in HCMV-infected cells. (A) RNA levels of ChREBP-α, ChREBP-β, and total ChREBP in HCMV-infected cells. Total RNA was isolated from mock- and HCMV-infected cells. RNA levels of ChREBP-α, ChREBP-β, and total ChREBP were quantified by qPCR using exon-specific primers. (B) RNA levels of total ChREBP, ChREBP-α, and ChREBP-β in HCMV-infected cells in response to high glucose level. After a 2-h incubation, mock- and HCMV-infected cells were cultured in either low-glucose (2.5 mM) or high-glucose (25 mM) medium. At 48 hpi, total RNA was isolated, and RNA levels of ChREBP-α, ChREBP-β, and total ChREBP were measured by qPCR. Total, total ChREBP; alpha, ChREBP-α; beta, ChREBP-β.

