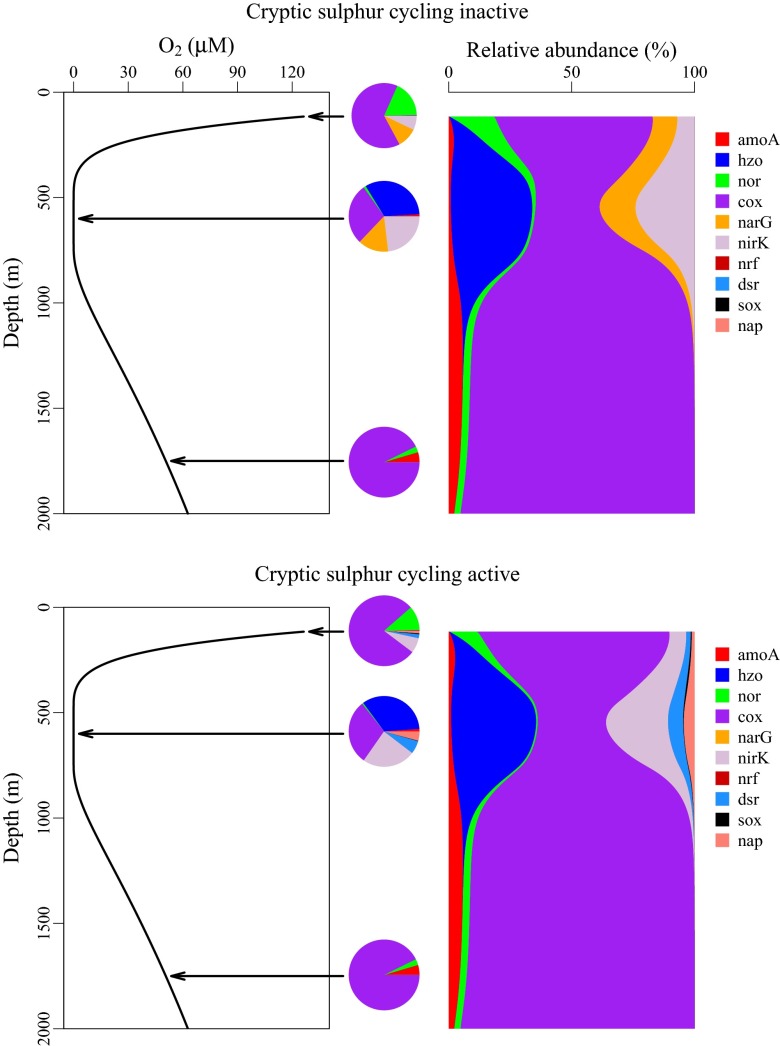
Fig. 3.
Profiles of oxygen and relative gene abundances from model simulation without and with cryptic sulfur cycling active. At three depths, gene abundances are plotted in pie charts demonstrating how direct comparisons can be made between model output and metagenomic data, which are typically expressed in relative terms at discrete points in space. cox, cytochrome-c oxidase.

