Fig. 1.
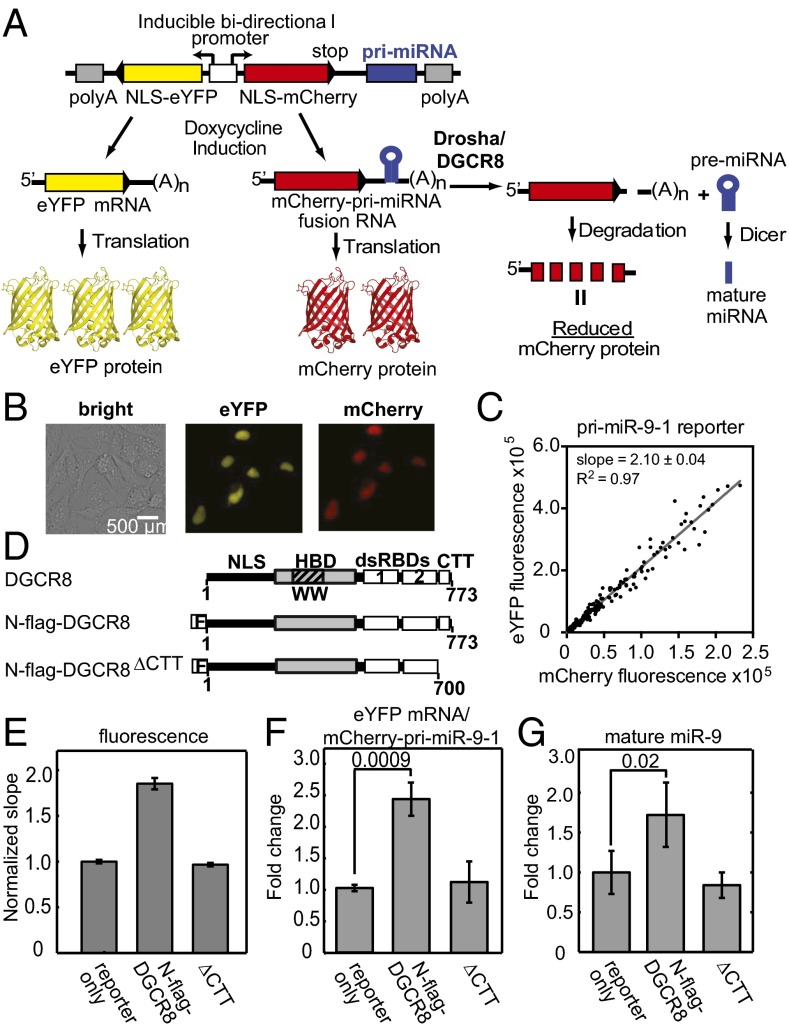
Live-cell pri-miRNA processing reporter assay. (A) Schematic depiction of the assay. NLS, nuclear localization signal. (B) Exemplary cell images showing nuclear expression of eYFP and mCherry via transfection of the pri-miR-9-1 reporter. (C) eYFP and mCherry fluorescence signals from transfection with the pri-miR-9-1 reporter are plotted for each cell. Slope from a linear regression is shown on the graph, with R2 = 0.97. (D) Schematics of human DGCR8 and the expression constructs used in the study. (E) Normalized fluorescence slopes for HeLa cells transfected with the pri-miR-9-1 reporter, either alone or with N-flag-DGCR8 expression plasmids. Error bars represent 95% confidence interval (95% CI) of the linear fit. The eYFP vs. mCherry scatter plots are in Fig. S1. (F and G) The abundance of the eYFP mRNA, the mCherry–pri-miRNA fusion RNA (F), and mature miR-9 (G) expression levels from E was measured using qRT-PCR (mean ± SD, n = 3). P values are labeled on the graphs.

