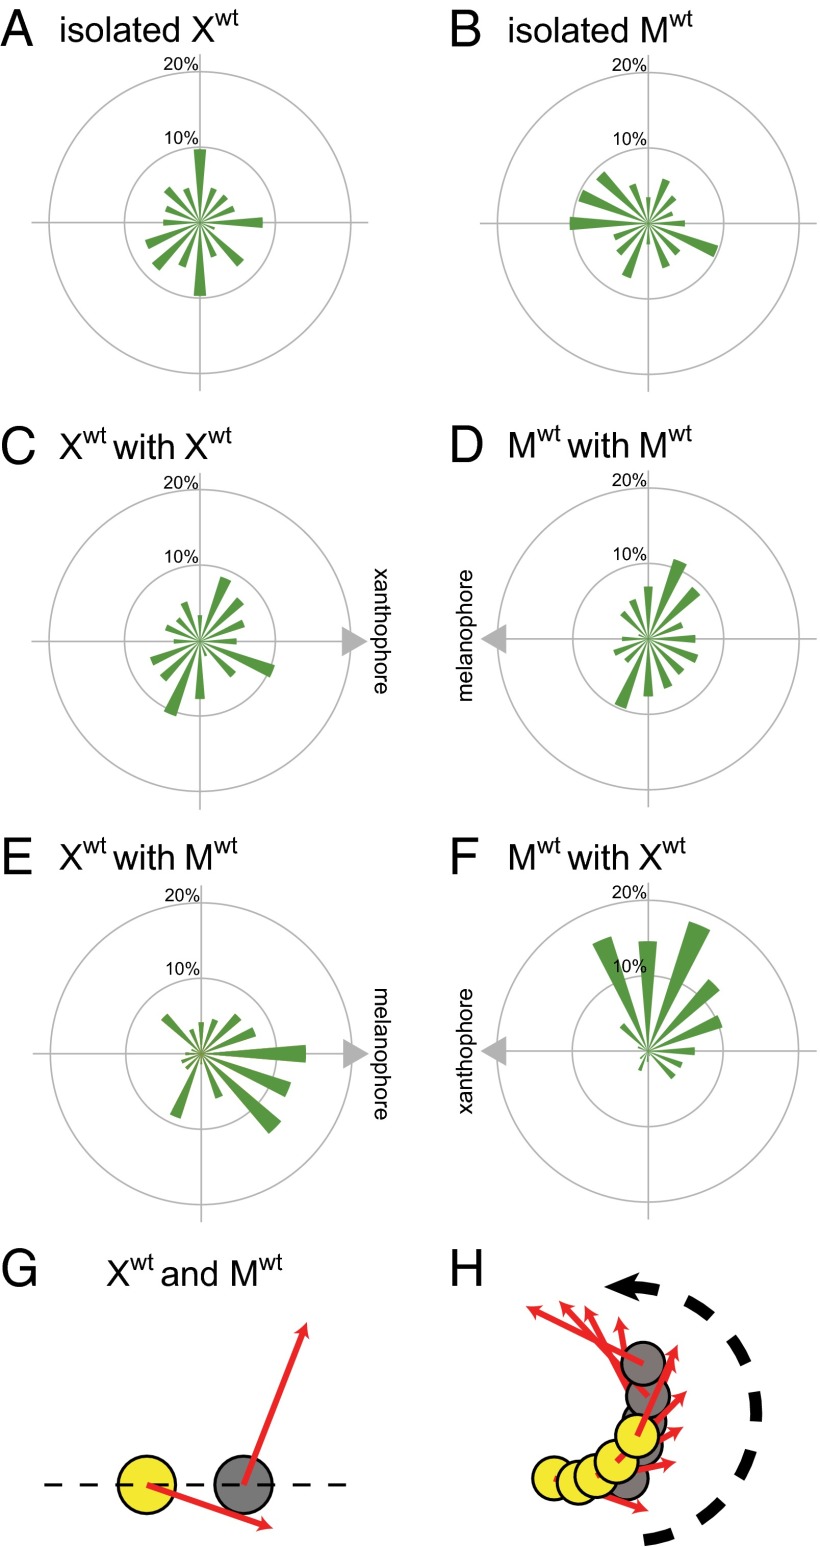
Fig. 3.
Statistical analysis of cell behavior. Cell movements were recorded for 48 h. (A–F) The cell movements every 4 h were analyzed with the rose diagram. (A) The migration profile of xanthophores without interactions with other cells (isolated condition). The mean scalar speed of xanthophores was 0.64 μm/h. (B) The migration profile of melanophores without interactions with other cells (isolated condition). The mean scalar speed of melanophores was 2.02 μm/h. (C) The movements of xanthophores interacting with other xanthophores. The mean scalar speed of xanthophores was 0.96 μm/h. (D) The migration profile of melanophores interacting with other melanophores. The mean scalar speed of melanophores was 2.03 μm/h. (E) The migration profile of xanthophores interacting with melanophores. The mean scalar speed of xanthophores was 1.60 μm/h. (F) The migration profile of melanophores interacting with xanthophores. The mean scalar speed of melanophores was 2.20 μm/h. (G) The merged movements of interacting melanophores and xanthophores. The red arrows represent the mean movement vectors calculated as the sum of the vector values of cell movements of every 4 h. (H) Typical movements of an interacting melanophore and xanthophore.

