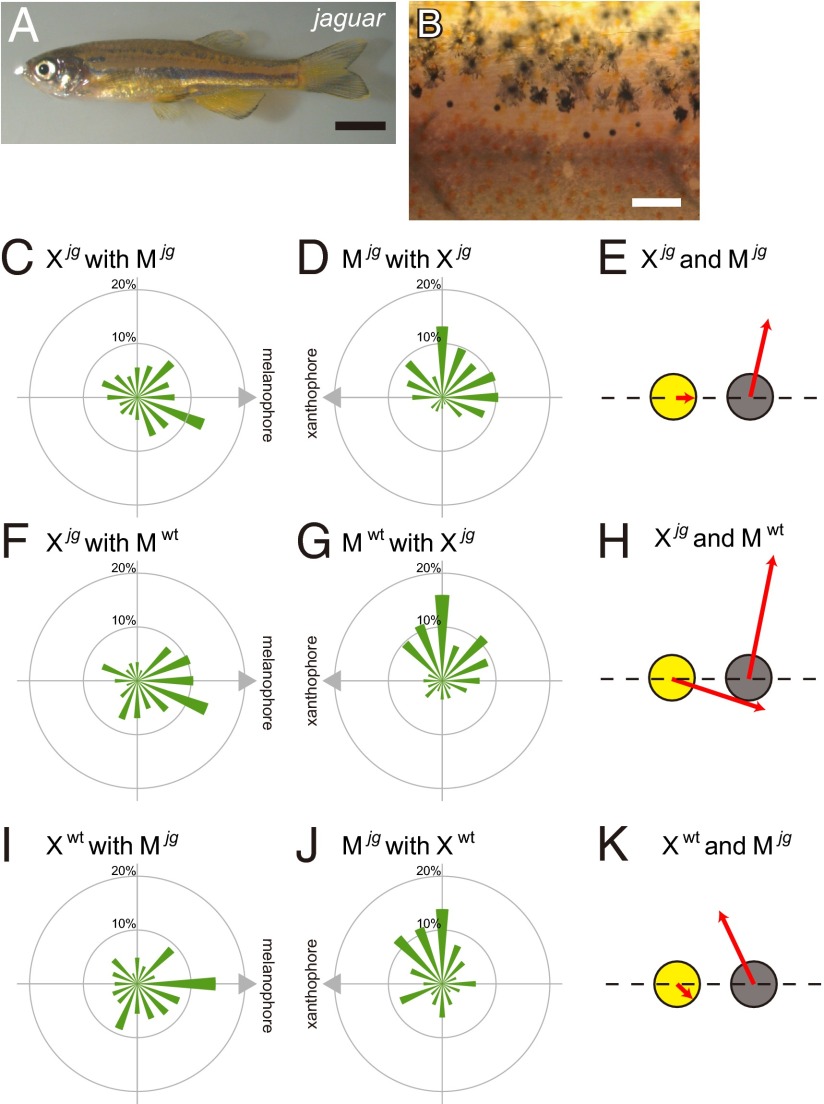
Fig. 4.
Interactions among pigment cells from jaguar. (A) The appearance of a jaguar mutant, which has wild and fuzzy stripes. (B) Magnified image of the surface of jaguar. Xanthophores and melanophores intermingle in the border region. (C) The migration profile of jaguar xanthophores interacting with jaguar melanophores. The mean scalar speed of xanthophores was 1.01 μm/h. (D) The migration profile of jaguar melanophores interacting with jaguar xanthophores. The mean scalar speed of xanthophores was 2.02 μm/h. (E) Merged movements of jaguar xanthophores and jaguar melanophores. (F) The migration profile of jaguar xanthophores interacting with WT melanophores. The mean scalar speed of xanthophores was 1.91 μm/h. (G) The migration profile of WT melanophores interacting with jaguar xanthophores. The mean scalar speed of melanophores was 2.57 μm/h. (H) Merged movements of jaguar xanthophores and WT melanophores. (I) The migration profile of WT xanthophores interacting with jaguar melanophores. The mean scalar speed of xanthophores was 1.17 μm/h. (J) The migration profile of jaguar melanophores interacting with WT xanthophores. The mean scalar speed of melanophores was 1.79 μm/h. (K) Merged movements of interacting WT xanthophores and jaguar melanophores. (Scale bar: A, 5.0 mm; B, 100 μm.)

