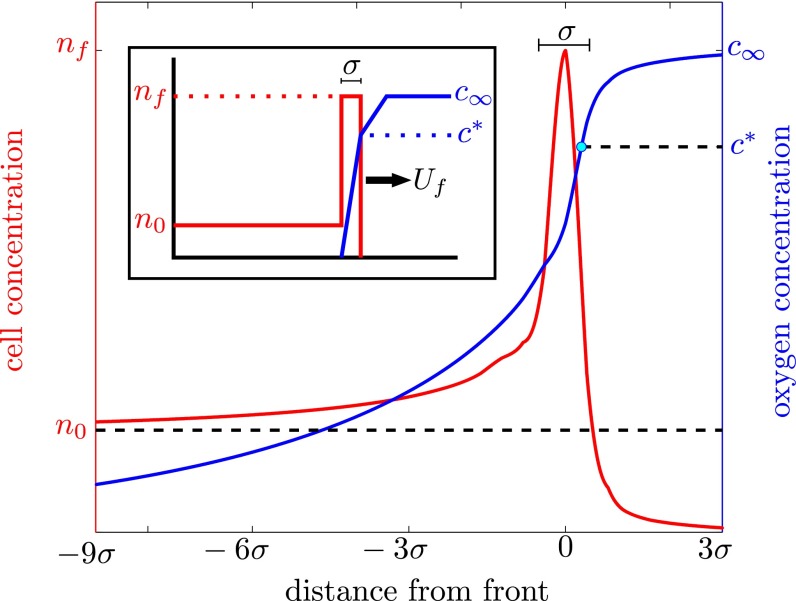
Fig. 4.
Numerical integration of Eqs. 1 and 2 shows that T. majus cells aggregate into the front with a constant translating form. As cells consume oxygen, the front moves in the direction of increasing oxygen concentration (blue). In this simulation, we chose  to accentuate the leading edge of the front and a small chemotactic coefficient so that the tail of the front can be clearly seen. (Inset) The geometry of this front can be understood by analyzing an idealized front.

