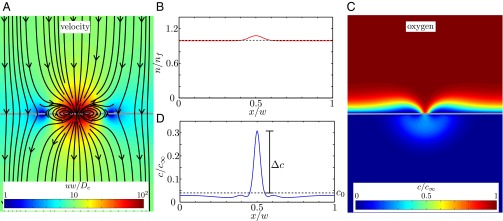
Fig. 6.

The flow of water and oxygen around a T. majus front is determined by the distribution of cells. (A) Cells, tethered to the veil (gray line), beat their flagella to pull water through the front. The velocity field is given in Eq. 4. (B) The distribution of cells in the one-dimensional front is a Gaussian perturbation composed of  of the total number of cells in the front. The dashed line shows average cell density. (C) The concentration field around the front (gray line) is a solution to Eq. 6, using the velocity field shown in A. (D) The concentration of oxygen on the front. The flow created by the cells pulls oxygen toward the most concentrated cells, creating a local maximum of amplitude c. The dashed line shows the concentration c0 in the absence of a density fluctuation.
