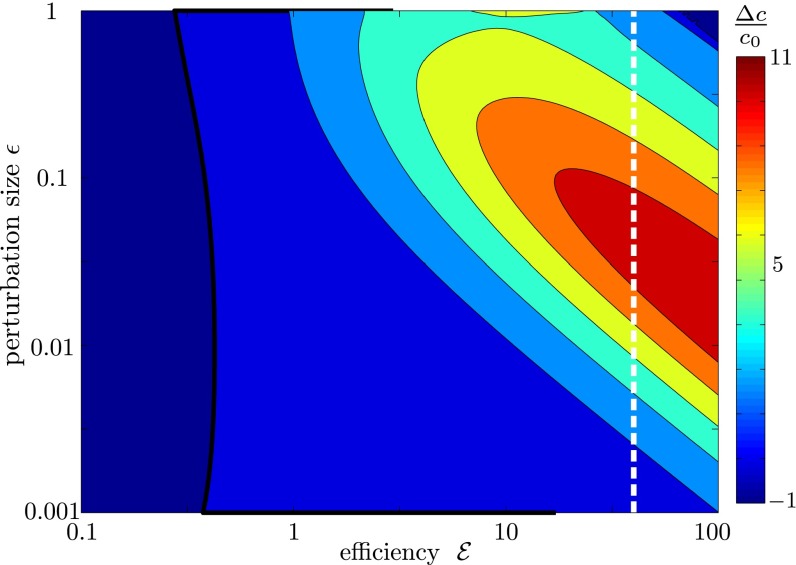
Fig. 7.
The fractional change in oxygen concentration as one varies both the size of the density perturbation ε and the efficiency  of cells.
  is defined as the rate at which cells pull water toward the front compared with the rate they consume oxygen. Points to the left of the solid black line correspond to perturbations that consume more oxygen than they draw. The dashed white line shows the estimated efficiency of T. majus cells.

