
Fig. 6.
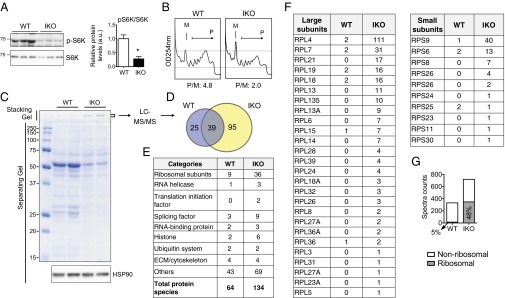
Reduced translation and increased ribosomal aggregation in the exocrine pancreas of Sel1LIKO mice. (A) Western blot analysis of (p)-S6K in of pancreas at day 13. Quantitation shown on the right. Data are mean ± SEM. *P < 0.05 by Student t test. (B) Polysome profiling analysis of the kidneys of WT and IKO mice at day 13. M, monosomes; P, polysomes; P/M, ratio of polysomes to monosomes based on quantitation of area under curve of each fraction. (C) Coomassie blue-stained SDS/PAGE gel of WT and IKO pancreatic lysates (loaded at an equal tissue weight) at day 13. Note stronger signals in the stacking gel of the IKO samples, which were sliced and subjected to LC-MS/MS analysis (D–G). HSP90, a loading control. (D) Venn diagram showing the overlap of hits in WT and IKO samples identified by the LC-MS/MS analysis. Complete list of hits shown in Table S1. (E) Functional categories of the hits. (F) Spectra counts of ribosomal subunits. RPL and RPS, 60S and 40S ribosomal subunits, respectively. (G) Diagram showing spectral counts of ribosomal and nonribosomal proteins. The percent of counts from ribosomal proteins were 5% in WT (15 of 332) and 48% in IKO (348 of 720), which accounted for the increased total spectral counts in IKO sample.