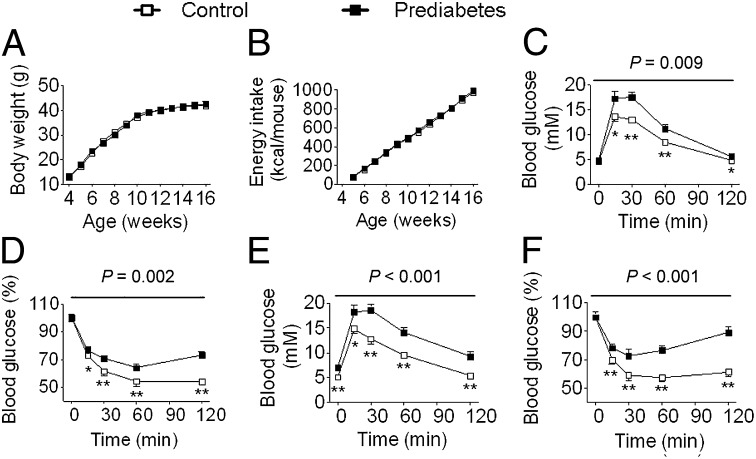
Fig. 1.
Paternal prediabetes leads to glucose intolerance and insulin insensitivity in male offspring. (A) Body weight trajectories (control, prediabetes: n = 13 and 16, respectively). (B) Cumulative energy intake (n = 6 and 5, respectively). (C) Blood glucose during GTT at 16 wk (n = 8 and 9, respectively). (D) Blood glucose during ITT at 16 wk (n = 10 and 7, respectively). (E) Blood glucose during GTT at 12 mo (n = 8 and 7, respectively). (F) Blood glucose during ITT at 12 mo (n = 8 and 7, respectively). Data are expressed as mean ± SEM; *P < 0.05, **P < 0.01, versus control. P values for significance between groups in repeated-measure analysis are shown (Upper, C–F).

