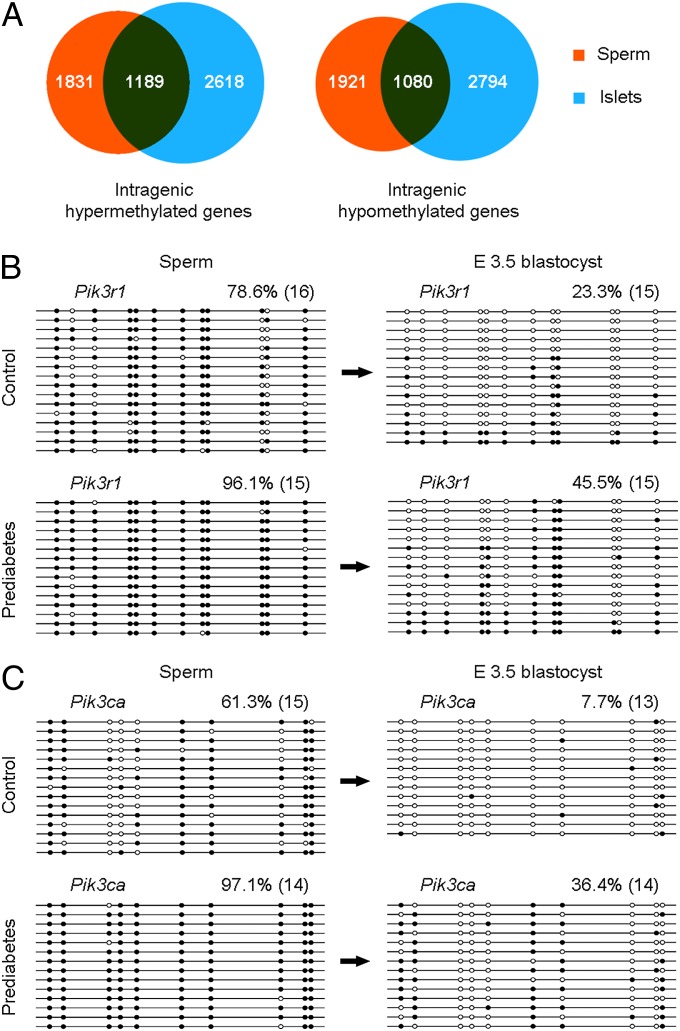
Fig. 4.
Comparison of DNA methylation patterns in sperm, islets, and E3.5 blastocysts. (A) Venn diagrams of differentially methylated intragenic element-associated genes show numerous overlaps between sperm and pancreatic islets. (B and C) Bisulfite sequencing of Pik3r1 (B) and Pik3ca (C) in sperm and E3.5 blastocysts show partial inheritance of DNA methylation from gametes. Genes are shown above the graphs. White circles represent unmethylated CpGs, and black circles represent methylated CpGs. Values on each bisulfite grouping indicate the percentage of CpG methylation, with number of analyzed clones in parentheses.

