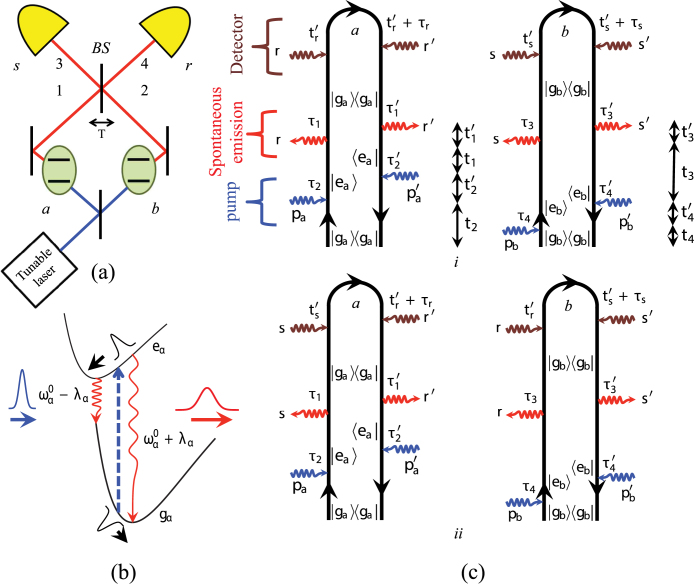
Figure 1. Time-and-frequency resolved measurement of PCC with spectral diffusion.
Schematic of the PCC experiment with two source molecules - (a), the two-level model of the molecule with SD used in our simulations - (b). (c) - Loop diagrams for the PCC rate of emitted photons from two molecules (for diagram rules see26). The left and right branches of each diagram represent interactions with ket- and bra- of the density matrix, respectively. Field-matter interactions with the pump pulses pa and pb (blue), spontaneously emitted s, s′, r, r′ photons (red) and detectors (brown).

