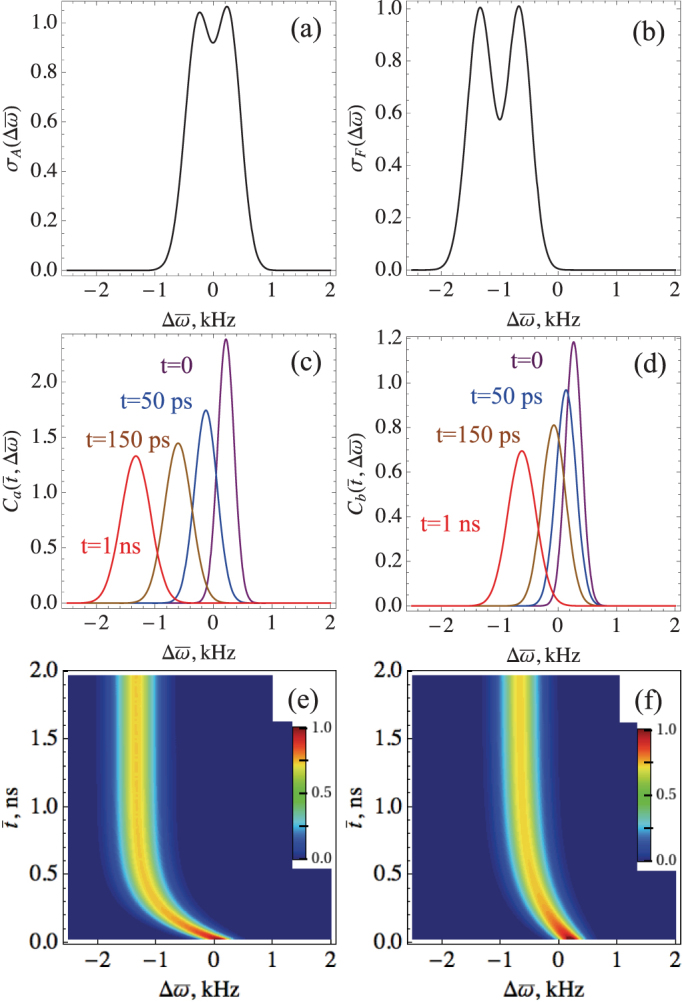
Figure 3. Effect of SD on individual molecule emission lineshapes.

Absorption (5) - (a) and fluorescence (6) - (b) line shapes vs displaced frequency  . Time-and-frequency resolved fluorescence (2) displayed as a snapshot spectra for molecule a - (c) and b - (d) and depicted as a two-dimensional contour plot - (e) and (f), respectively. Parameters of the system are:
  ,
,  , Δa = 220 MHz, Δb = 205 MHz, Λa = 5 MHz, Λb = 3 MHz,
  , σp = 102 MHz,
  , j = r, s, and the temperature is set to 10 K.
