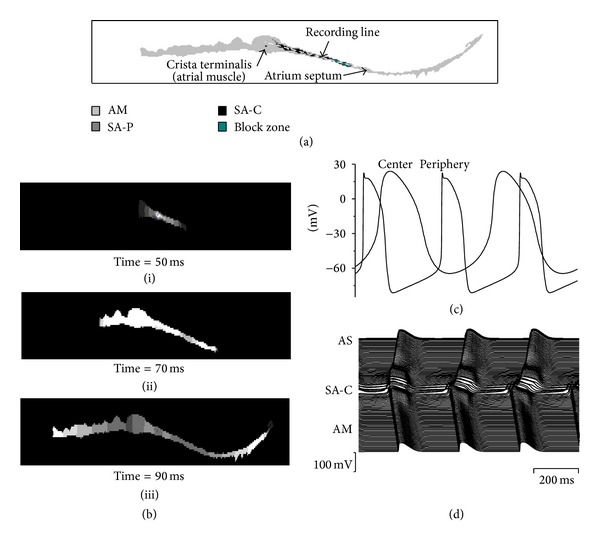
Figure 1.

Model of the SAN and surrounding atrial tissue. (a) Color-coded distribution of cell types throughout the 2D tissue slice. (b) Snapshots of initiation and conduction in 2D anatomical model at various times after initial configuration; (i) 50 ms; (ii) 70 ms; (iii) 90 ms. (c) Action potentials in one cell of the central and peripheral SAN. (d) Action potential profiles during conduction through the slice. As, atrial septum; SA-C, SAN center; AM, atrial muscle (CT).
