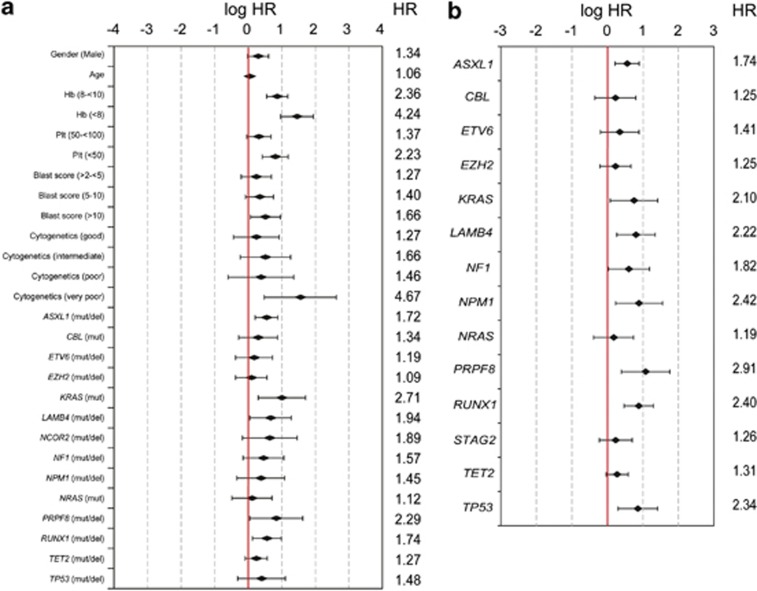
Figure 3.
Illustration of hazard ratios for Model-1 and Model-2. Hazard ratios (HRs, given in numbers) as well as logHR and their 95% confidential intervals (given as chart) for parameters used for Model-1 including clinical and genetic variables (a) and for Model-2 including only genetic variables (referring to the training cohort) (b) are plotted. For a, baseline level for the analysis was the respective IPSS-R risk category with the least risk score (hemoglobin: ⩾10 g/dl, platelets score: ⩾100 × 109/l, blast score: ⩽2%, cytogenetic score very good).

