
Figure 3. Rb-Family Deficient Cells Have Elevated ROS Levels, Increased Total Glutathione, and a Lower Ratio of GSH to Total Glutathione.
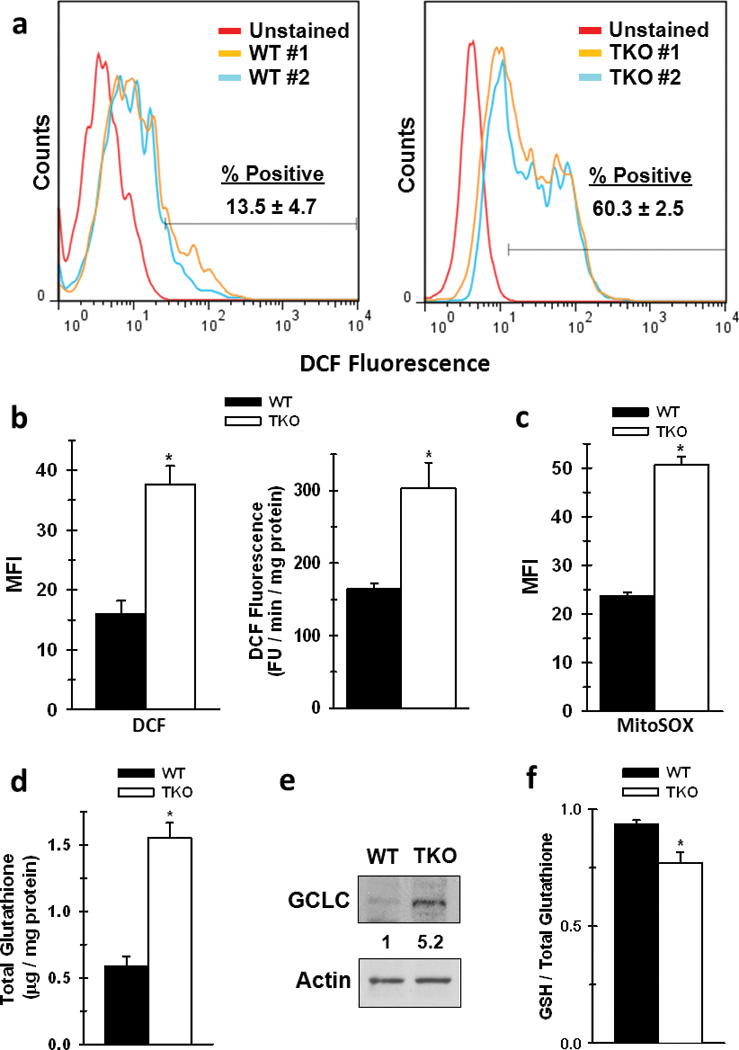
a. Representative flow cytometry histograms of WT or TKO measuring DCF fluorescence. % positive cells were determined as number of stained cells beyond that of the unstained population. b. Mean fluorescent intensity (MFI) between WT and TKO cells were determined by FlowJo software. Data are presented as mean ± s.d. from duplicate measurements from two separate experiments. * p < 0.01. Rate of ROS production was determined in whole WT or TKO cells by measurement of DCF fluorescence as a function of time. Data are represented as relative FU / min / mg protein, and shown as the mean ± s.d. of 5 replicates from three independent experiments. * p < 0.01. c. MFI of WT and TKO MEFs stained with the mitochondrial specific ROS indicator MitoSOX. Data are presented as mean ± s.d. of three replicates from two separate experiments. d. Total glutathione was measured as described in the Materials and Methods. Data are represented as µg / mg protein between WT and TKO cells. Shown is the mean ± s.d. from three replicates from two separate experiments. * p < 0.005 e. Protein expression of gamma glutamyl-cysteine ligase (GCLC). Shown is a representative image from three independent cell lysate preparations, and ratio of expression was determined by densitometry analysis with WT expression set to 1. f. The ratio of GSH / Total glutathione was measured as described in the Materials and Methods. Data are represented as the ratio of GSH / total glutathione between WT and TKO cells. Shown is the mean ± s.d. from three replicates from two separate experiments. p < 0.01.