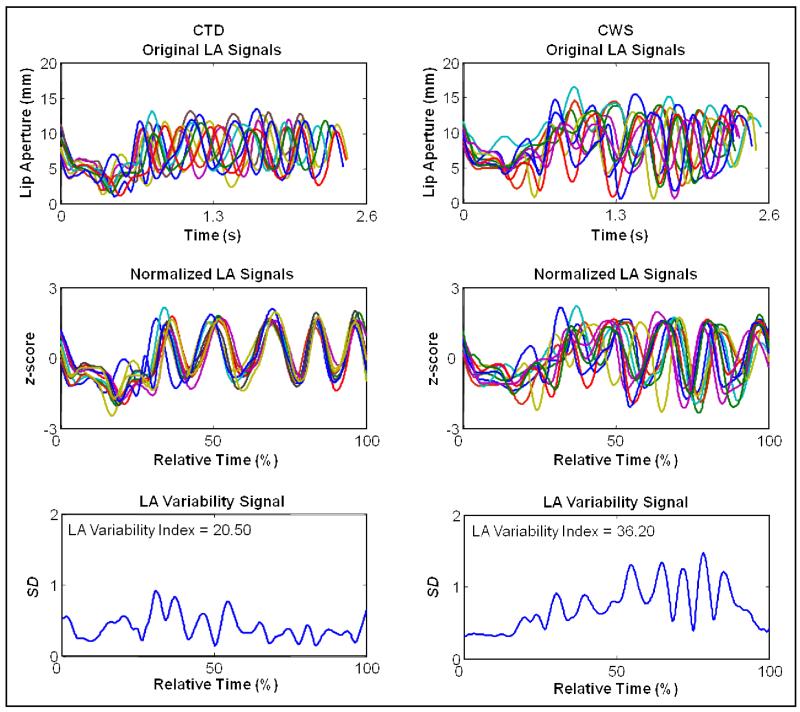
Figure 1.
Kinematic data processing steps. Original LA signals (top plot), normalized LA signals (middle plot), and the LA variability signal from productions of the long complex sentence by one CTD (left column) and one CWS (right column). The bottom plot displays standard deviations (SDs) computed at each 2% point in relative time. The sum of these SDs yields the LA variability index for each participant.

