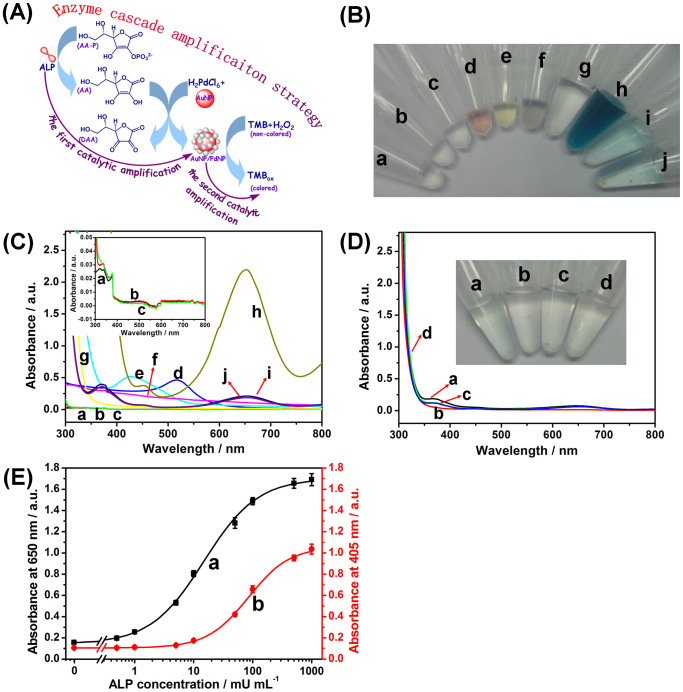
Figure 2.
(A) Schematic illustration of enzyme cascade amplification strategy (ECAS). (B) The photographs of (a) ALP, (b) AA-P, (c) ALP + AA-P, (d) AuNP, (e) K2PdCl6 + HCl, (f) (ALP + AA-P) + AuNP + (K2PdCl6 + HCl), (g) TMB + H2O2, (h) (ALP + AA-P) + AuNP + (K2PdCl6 + HCl) + (TMB + H2O2), (i) AA-P + AuNP + (K2PdCl6 + HCl) + (TMB + H2O2), and (j) ALP + AuNP + (K2PdCl6 + HCl) + (TMB + H2O2). (C) The corresponding UV-vis absorption spectra of photograph ‘B’. (D) UV-vis absorption spectra of (a) AuNP + (TMB + H2O2), (b) ALP + AuNP + HCl + (TMB + H2O2), (c) AA-P + AuNP + HCl + (TMB + H2O2), and (d) ALP + AA-P + AuNP + HCl + (TMB + H2O2) (Inset: the corresponding photographs). (E) Calibration curves of (a) the developed enzyme cascade amplification strategy at 650 nm and (b) the conventional enzyme-linked immunosorbent assay at 405 nm toward ALP standards with various concentrations. Error bars indicate standard deviations (n = 3).

