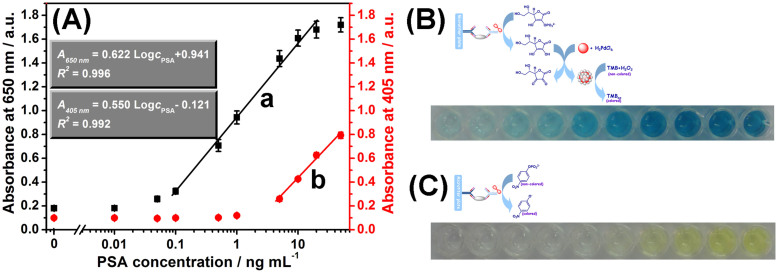
Figure 5. (A) Calibration plots of various immunoassay protocols toward PSA standards with various concentrations using (a) the developed ECAS-CIA and (b) conventional colorimetric ELISA method, respectively, (B) the corresponding photographs of curve ‘a’, and (C) the corresponding photographs of curve ‘b’.
Error bars indicate standard deviations (n = 8).

