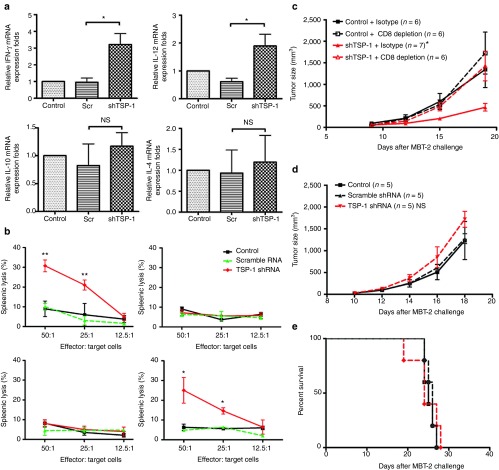
Figure 3.
The immunological mechanism of the antitumor response induced by TSP-1 shRNA. (a) Th1 cytokines were induced in the lymph nodes of mice that received TSP-1 shRNA. Expression levels of interferon-γ (IFNγ), interleukin (IL)-12, IL-10, and IL-4 in lymph nodes were measured with real-time polymerase chain reaction. The relative expression fold was compared with control group (*P < 0.05; n = 3 mice per group, mean ± SEM). (b) Splenocytes from mice treated with TSP-1 shRNA were cytotoxic against tumor cells. Effector cells were isolated from mice that received the indicated treatments. MBT-2 luciferase cells were used as target cells. Cytotoxicity was measured by detecting the release of luciferase. Upper left panel: cytotoxicity splenocytes against MBT-2 tumor cells in MBT-2 mouse tumor model. Upper right panel: cytotoxicity splenocytes against LL2 tumor cells in MBT-2 mouse tumor model. Lower left panel: cytotoxicity of CD8+ T-cell–depleted splenocytes against MBT-2 tumor cells in MBT-2 mouse tumor model. Lower right panel: cytotoxicity of NK-cell–depleted splenocytes against MBT-2 tumor cells in MBT-2 mouse tumor model (**P < 0.01, control versus TSP-1 shRNA; *P < 0.05, control versus TSP-1 shRNA). (c) Growth curve of MBT-2 tumor cells in C3H/HeN with CD8 depletion (*P < 0.05, shTSP-1 versus shTSP-1 + CD8 depletion). (d) MBT-2 tumor size in NOD-SCID mice with the indicated treatments. (e) Lifespan of MBT-2 tumor-bearing NOD-SCID mice. mRNA, messenger RNA; NS, no statistical difference; Scr, scramble; shRNA, short hairpin RNA; TSP-1, thrombospondin 1.

