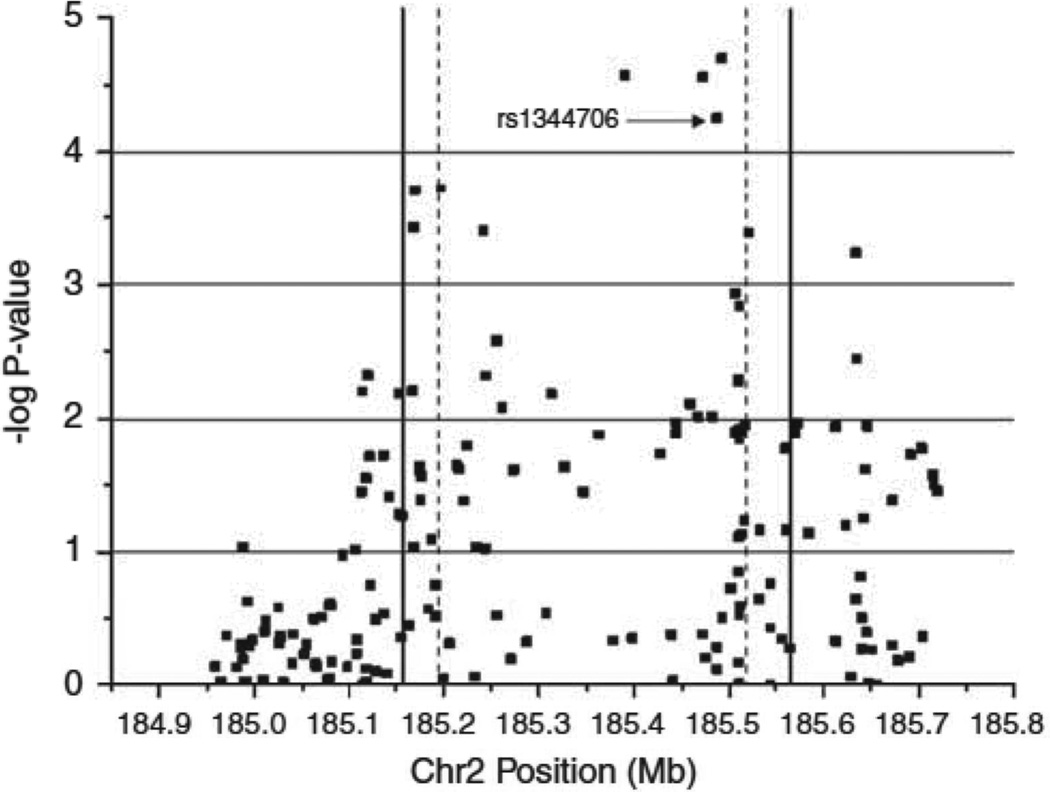
Figure 1. fatSNP1 results for ZNF804A.
Armitage trend P-values (−log10) for 176 SNPs genotyped during fatSNP phase 1. Dashed lines represent the boundaries of ZNF804A transcript (NM_194250). Solid lines represent the region targeted by genomic resequencing. rs1344706 was the most significant SNP in the earlier GWAS study (O’Donovan et al 2008). Chromosome position based on NCBI build36.

