
Figure 2.
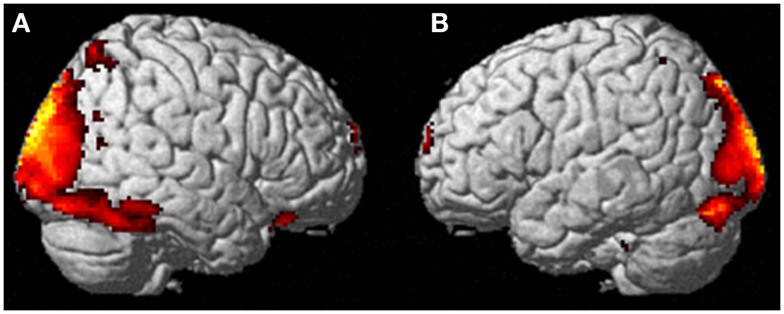
Areas of reduced activity during the ECEs compared to rest. The visual cortex is particularly impacted. (A) Representation of the right side; (B) activity on the left. The p-value for this image was set at 0.05 FWE corrected.
Official websites use .gov
A
.gov website belongs to an official
government organization in the United States.
Secure .gov websites use HTTPS
A lock (
) or https:// means you've safely
connected to the .gov website. Share sensitive
information only on official, secure websites.
Areas of reduced activity during the ECEs compared to rest. The visual cortex is particularly impacted. (A) Representation of the right side; (B) activity on the left. The p-value for this image was set at 0.05 FWE corrected.