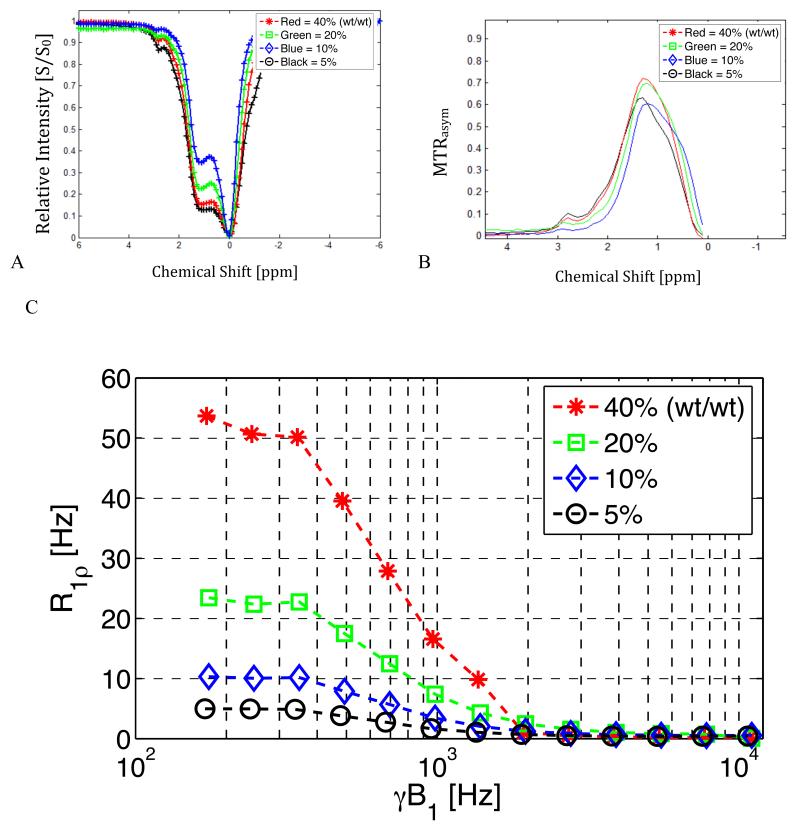
Figure 8.
Experimental results for solutions of dextran with increasing concentration.
8.a. CEST data for solutions of dextran of concentration 5-40% (wt/wt). Note the dominant peak at 1.2 ppm.
8.b. Corresponding MTRasym for figure 8.a.
8.c. R1ρ dispersion results for the same dextran samples used in 8.a.

