
Figure 2.
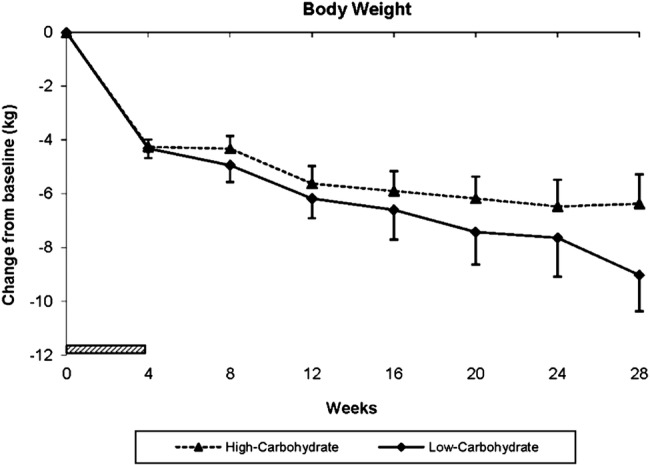
Weight loss during the study on both diets. Weight loss during the study on both diets. Values represent mean±SEM of the change from baseline during the metabolic and ad libitum phases, using multiple imputation (taking the mean of 5 sets of randomly imputed values) to generate data for those who dropped out or had missing values on the ad libitum phase. The change in weight during the ad libitum phase was significantly reduced (P=0.047) on the low versus the high carbohydrate diet using all available data in the repeated measures mixed model analysis. Cross hatched bar represents the metabolic phase.